注解
Click here 下载完整的示例代码
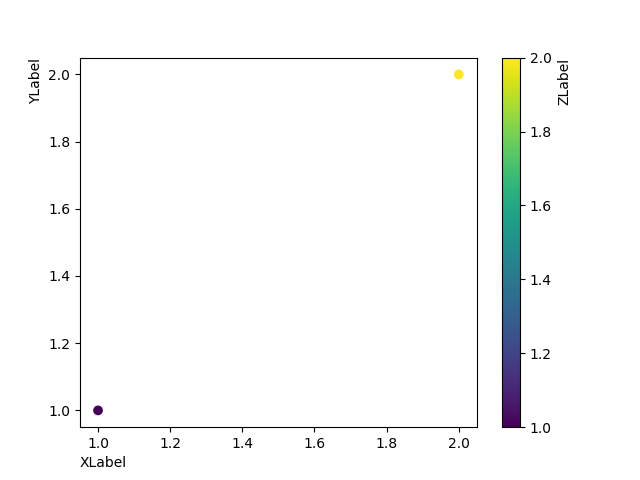
轴标签位置
调用时选择轴标签位置 set_xlabel 和 set_ylabel 以及色条。
import matplotlib.pyplot as plt

fig, ax = plt.subplots()

sc = ax.scatter([1, 2], [1, 2], c=[1, 2])
ax.set_ylabel('YLabel', loc='top')
ax.set_xlabel('XLabel', loc='left')
cbar = fig.colorbar(sc)
cbar.set_label("ZLabel", loc='top')

plt.show()
关键词:matplotlib代码示例,codex,python plot,pyplot Gallery generated by Sphinx-Gallery