注解
Click here 下载完整的示例代码
使用创建多个子批次 plt.subplots
pyplot.subplots 通过一个调用创建图形和一个子图网格,同时提供对如何创建单个绘图的合理控制。对于更高级的用例,您可以使用 GridSpec 更一般的子片区布局或 Figure.add_subplot 用于在图形中的任意位置添加子批次。
只有一个子图的数字
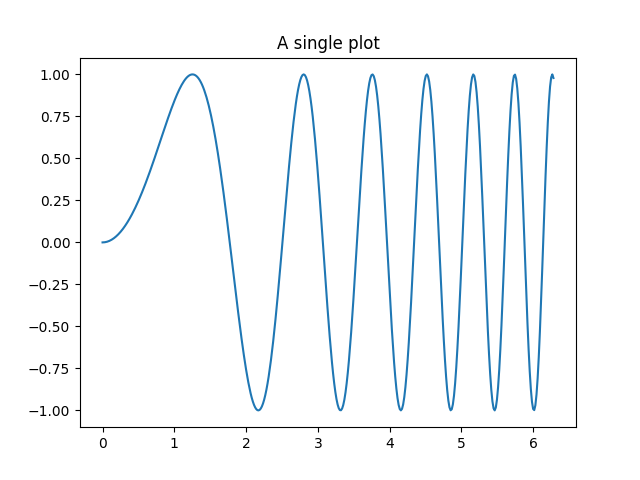
subplots() 不带参数返回 Figure 一个单人间 Axes .
这实际上是创建单个图形和轴的最简单和推荐的方法。
fig, ax = plt.subplots()
ax.plot(x, y)
ax.set_title('A single plot')
出:
Text(0.5, 1.0, 'A single plot')
在一个方向上堆叠子批次
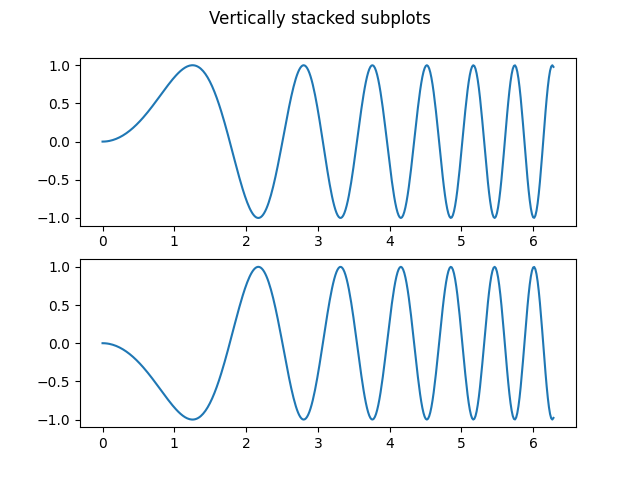
的前两个可选参数 pyplot.subplots 定义子地块网格的行数和列数。
当只朝一个方向堆叠时,返回 axs 是一个1D numpy数组,包含已创建轴的列表。
fig, axs = plt.subplots(2)
fig.suptitle('Vertically stacked subplots')
axs[0].plot(x, y)
axs[1].plot(x, -y)

出:
[<matplotlib.lines.Line2D object at 0x7fa9c0bb6668>]
如果只创建几个轴,可以立即将它们解压为每个轴的专用变量。这样,我们就可以使用 ax1 而不是更冗长 axs[0] .
fig, (ax1, ax2) = plt.subplots(2)
fig.suptitle('Vertically stacked subplots')
ax1.plot(x, y)
ax2.plot(x, -y)
出:
[<matplotlib.lines.Line2D object at 0x7faa0a87c940>]
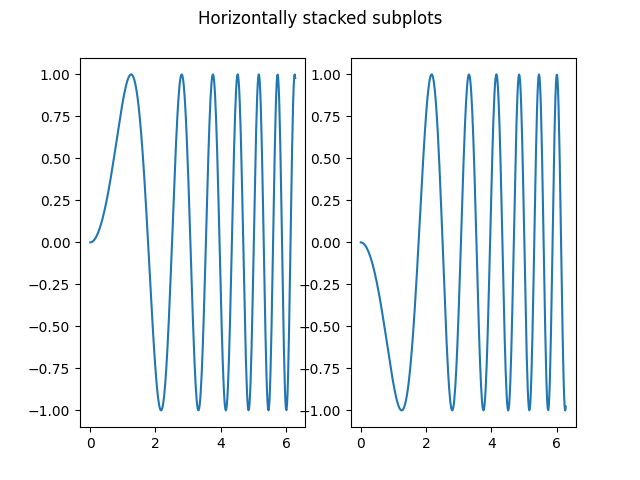
要获得并排子批次,请传递参数 1, 2 一行两列。
fig, (ax1, ax2) = plt.subplots(1, 2)
fig.suptitle('Horizontally stacked subplots')
ax1.plot(x, y)
ax2.plot(x, -y)
出:
[<matplotlib.lines.Line2D object at 0x7faa0a846048>]
在两个方向上堆叠子批次
当向两个方向堆叠时,返回 axs 是一个2D NumPy数组。
如果必须为每个子批次设置参数,那么可以使用 for ax in axs.flat: .
fig, axs = plt.subplots(2, 2)
axs[0, 0].plot(x, y)
axs[0, 0].set_title('Axis [0, 0]')
axs[0, 1].plot(x, y, 'tab:orange')
axs[0, 1].set_title('Axis [0, 1]')
axs[1, 0].plot(x, -y, 'tab:green')
axs[1, 0].set_title('Axis [1, 0]')
axs[1, 1].plot(x, -y, 'tab:red')
axs[1, 1].set_title('Axis [1, 1]')

for ax in axs.flat:
    ax.set(xlabel='x-label', ylabel='y-label')

# Hide x labels and tick labels for top plots and y ticks for right plots.
for ax in axs.flat:
    ax.label_outer()
![Axis [0, 0], Axis [0, 1], Axis [1, 0], Axis [1, 1]](../../_images/sphx_glr_subplots_demo_005.png)
您也可以在2D中使用元组解包来将所有子批次分配给专用变量:
fig, ((ax1, ax2), (ax3, ax4)) = plt.subplots(2, 2)
fig.suptitle('Sharing x per column, y per row')
ax1.plot(x, y)
ax2.plot(x, y**2, 'tab:orange')
ax3.plot(x, -y, 'tab:green')
ax4.plot(x, -y**2, 'tab:red')

for ax in fig.get_axes():
    ax.label_outer()

共享轴
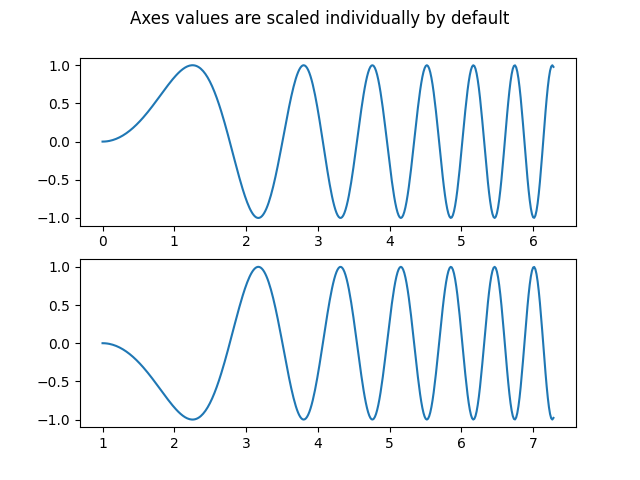
默认情况下,每个轴单独缩放。因此,如果范围不同,则子批次的刻度值不会对齐。
fig, (ax1, ax2) = plt.subplots(2)
fig.suptitle('Axes values are scaled individually by default')
ax1.plot(x, y)
ax2.plot(x + 1, -y)
出:
[<matplotlib.lines.Line2D object at 0x7faa0aa09be0>]
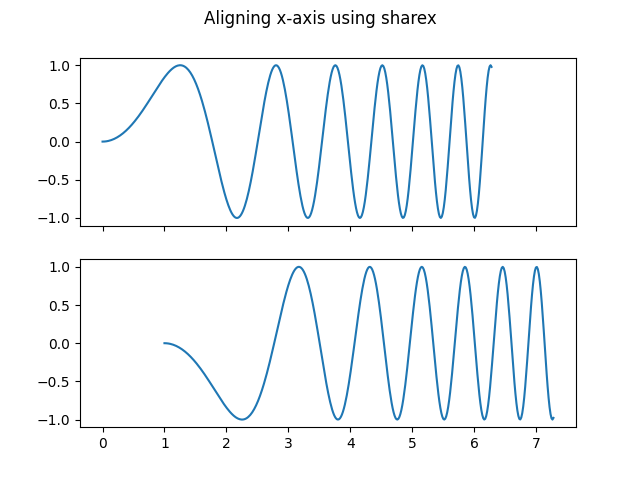
你可以使用 股票 或 共享 对齐水平或垂直轴。
fig, (ax1, ax2) = plt.subplots(2, sharex=True)
fig.suptitle('Aligning x-axis using sharex')
ax1.plot(x, y)
ax2.plot(x + 1, -y)
出:
[<matplotlib.lines.Line2D object at 0x7faa0cdc7048>]
设置 股票 或 共享 到 True 允许在整个网格中全局共享,也就是说,在使用时,垂直堆叠子图的y轴也具有相同的比例 sharey=True .
出:
[<matplotlib.lines.Line2D object at 0x7faa0d048f98>]
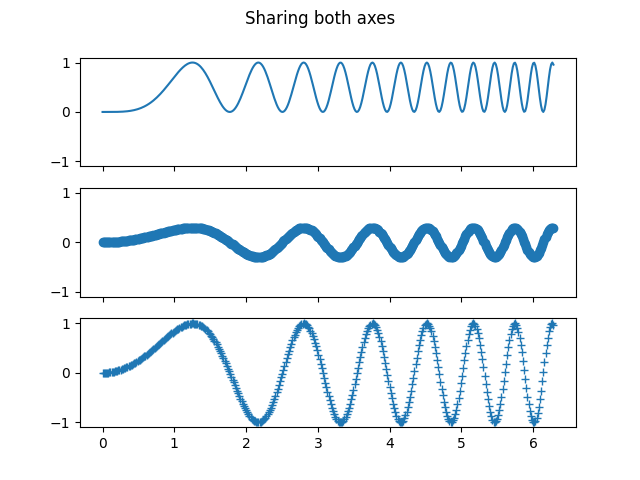
对于共享轴的子批次,一组记号标签就足够了。内轴的刻度标签通过以下方式自动删除 股票 和 共享 . 但子片区之间仍有一个未使用的空白区域。
为了精确地控制子地块的位置,可以显式地创建 GridSpec 具有 add_gridspec ,然后调用 subplots 方法。例如,我们可以使用 add_gridspec(hspace=0) .
label_outer 是一种从不在网格边缘的子批次中删除标签和记号的简便方法。
fig = plt.figure()
gs = fig.add_gridspec(3, hspace=0)
axs = gs.subplots(sharex=True, sharey=True)
fig.suptitle('Sharing both axes')
axs[0].plot(x, y ** 2)
axs[1].plot(x, 0.3 * y, 'o')
axs[2].plot(x, y, '+')

# Hide x labels and tick labels for all but bottom plot.
for ax in axs:
    ax.label_outer()

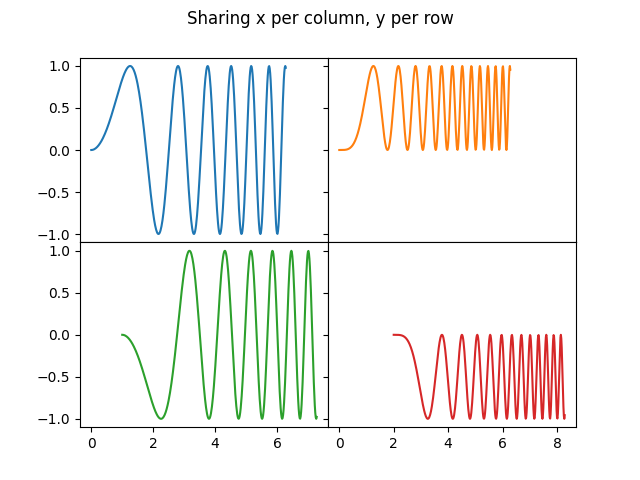
Apart from True and False, both sharex and sharey accept the
values 'row' and 'col' to share the values only per row or column.
fig = plt.figure()
gs = fig.add_gridspec(2, 2, hspace=0, wspace=0)
(ax1, ax2), (ax3, ax4) = gs.subplots(sharex='col', sharey='row')
fig.suptitle('Sharing x per column, y per row')
ax1.plot(x, y)
ax2.plot(x, y**2, 'tab:orange')
ax3.plot(x + 1, -y, 'tab:green')
ax4.plot(x + 2, -y**2, 'tab:red')

for ax in axs.flat:
    ax.label_outer()
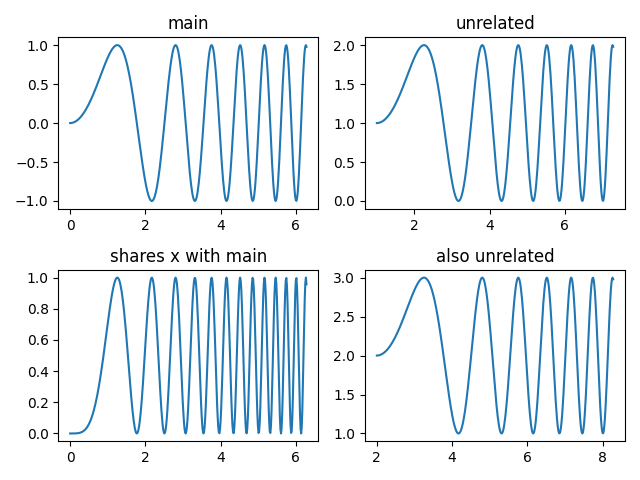
如果您想要一个更复杂的共享结构,可以先创建没有共享的轴网格,然后调用 axes.Axes.sharex 或 axes.Axes.sharey 添加共享信息。
fig, axs = plt.subplots(2, 2)
axs[0, 0].plot(x, y)
axs[0, 0].set_title("main")
axs[1, 0].plot(x, y**2)
axs[1, 0].set_title("shares x with main")
axs[1, 0].sharex(axs[0, 0])
axs[0, 1].plot(x + 1, y + 1)
axs[0, 1].set_title("unrelated")
axs[1, 1].plot(x + 2, y + 2)
axs[1, 1].set_title("also unrelated")
fig.tight_layout()
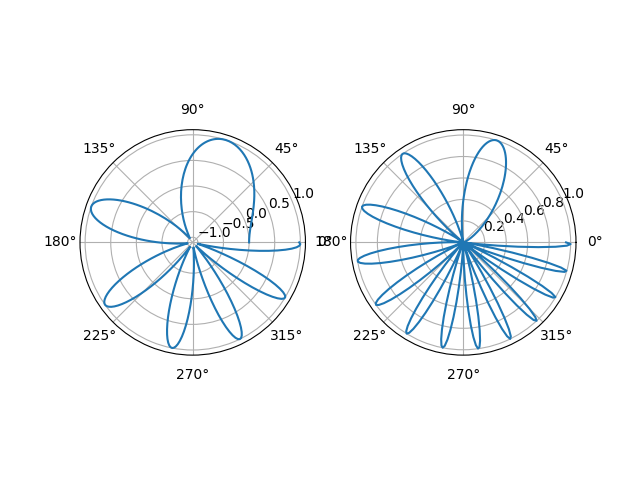
极轴
参数 subplot_kw 属于 pyplot.subplots 控制子批次属性(另请参见 Figure.add_subplot ). 特别是,这可以用来创建极轴的栅格。
脚本的总运行时间: (0分8.555秒)
关键词:matplotlib代码示例,codex,python plot,pyplot Gallery generated by Sphinx-Gallery