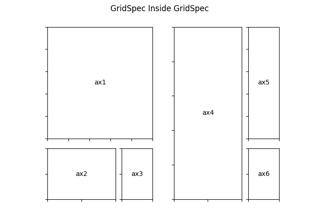
matplotlib.gridspec.GridSpecBase
-
class
matplotlib.gridspec.GridSpecBase(nrows, ncols, height_ratios=None, width_ratios=None)[源代码]¶ 基类:
objectgridspec的基类,用于指定将放置子批次的网格的几何图形。
参数: - 恩罗利息
网格的行数和列数。
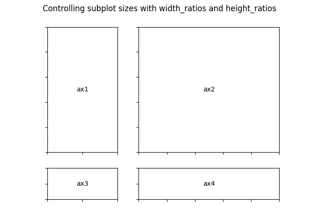
- width_ratios :类似数组的长度 恩科斯 可选数组长度
定义列的相对宽度。每列的相对宽度为
width_ratios[i] / sum(width_ratios). 如果未指定,则所有列的宽度都相同。- height_ratios :类似数组的长度 诺尔斯 可选数组长度
定义行的相对高度。每列的相对高度为
height_ratios[i] / sum(height_ratios). 如果不给定,则所有行的高度都相同。
-
__dict__= mappingproxy({'__module__': 'matplotlib.gridspec', '__doc__': '\n A base class of GridSpec that specifies the geometry of the grid\n that a subplot will be placed.\n ', '__init__': <function GridSpecBase.__init__>, '__repr__': <function GridSpecBase.__repr__>, 'nrows': <property object>, 'ncols': <property object>, 'get_geometry': <function GridSpecBase.get_geometry>, 'get_subplot_params': <function GridSpecBase.get_subplot_params>, 'new_subplotspec': <function GridSpecBase.new_subplotspec>, 'set_width_ratios': <function GridSpecBase.set_width_ratios>, 'get_width_ratios': <function GridSpecBase.get_width_ratios>, 'set_height_ratios': <function GridSpecBase.set_height_ratios>, 'get_height_ratios': <function GridSpecBase.get_height_ratios>, 'get_grid_positions': <function GridSpecBase.get_grid_positions>, '__getitem__': <function GridSpecBase.__getitem__>, 'subplots': <function GridSpecBase.subplots>, '__dict__': <attribute '__dict__' of 'GridSpecBase' objects>, '__weakref__': <attribute '__weakref__' of 'GridSpecBase' objects>, '__annotations__': {}})
-
__getitem__(key)[源代码]¶ 创建并返回
SubplotSpec实例。
-
__init__(nrows, ncols, height_ratios=None, width_ratios=None)[源代码]¶ 参数: - 恩罗利息
网格的行数和列数。
- width_ratios :类似数组的长度 恩科斯 可选数组长度
定义列的相对宽度。每列的相对宽度为
width_ratios[i] / sum(width_ratios). 如果未指定,则所有列的宽度都相同。- height_ratios :类似数组的长度 诺尔斯 可选数组长度
定义行的相对高度。每列的相对高度为
height_ratios[i] / sum(height_ratios). 如果不给定,则所有行的高度都相同。
-
__module__= 'matplotlib.gridspec'
-
__weakref__¶ 对象的弱引用列表(如果已定义)
-
get_grid_positions(fig, raw=False)[源代码]¶ 返回栅格单元在地物坐标中的位置。
参数: - fig :
Figure图形 应应用网格的图形。子批次参数(边距和子批次之间的间距)取自 fig .
- rawbool,默认值:False
如果 True ,不考虑图形的子图参数。网格跨越范围 [0, 1] 在两个方向上都没有边距,网格单元之间没有空间。这用于受约束的布局。
返回: - 底部,顶部,左侧,右侧数组
图形坐标中栅格单元的底部、顶部、左侧和右侧位置。
- fig :
-
property
ncols¶ 网格中的列数。
-
new_subplotspec(loc, rowspan=1, colspan=1)[源代码]¶ 创建并返回
SubplotSpec实例。参数: - loc(内景,内景)
子批次在网格中的位置为
(row_index, column_index).- 行span,colspanint,默认值:1
子批次在网格中应跨越的行数和列数。
-
property
nrows¶ 网格中的行数。
-
set_height_ratios(height_ratios)[源代码]¶ 设置行的相对高度。
height_ratios 必须有长度 诺尔斯 . 每行的相对高度为
height_ratios[i] / sum(height_ratios).
-
set_width_ratios(width_ratios)[源代码]¶ 设置列的相对宽度。
width_ratios 必须有长度 恩科斯 . 每列的相对宽度为
width_ratios[i] / sum(width_ratios).
-
subplots(*, sharex=False, sharey=False, squeeze=True, subplot_kw=None)[源代码]¶ 添加此
GridSpec它的父图形。这个实用程序包装器使在一次调用中创建子块的公共布局变得方便。
参数: - 斯莱西bool或'none'、'all'、'row'、'col',默认值:false
控制x之间的属性共享( 股票 )或y( 共享 轴:
- “全部”或“全部”:X轴或Y轴将在所有子批次之间共享。
- 假或“无”:每个子批次X轴或Y轴都是独立的。
- “row”:每个子批次行将共享一个X轴或Y轴。
- “col”:每个子批次列将共享一个x轴或y轴。
当子批次沿列具有共享的X轴时,仅创建底部子批次的X记号标签。同样,当子批次沿行具有共享的Y轴时,只创建第一列子批次的Y记号标签。要稍后打开其他子批次的标记标签,请使用
tick_params.- squeezebool,可选,默认值:true
- 如果为真,则从返回的轴数组中挤出额外的尺寸:
- 如果只构造了一个子块(nrows=ncols=1),则生成的单轴对象将作为标量返回。
- 对于nx1或1xm子批次,返回的对象是轴对象的1d numpy对象数组。
- 对于nxm,n>1和m>1的子批次作为二维数组返回。
- 如果为false,则根本不进行压缩:返回的axes对象始终是包含axes实例的2d数组,即使它最终是1x1。
- 如果为真,则从返回的轴数组中挤出额外的尺寸:
- subplot_kw可选的
将关键字传递给
add_subplot用于创建每个子批次的调用。
返回: