注解
Click here 下载完整的示例代码
箱线图抽屉功能
这个例子演示了如何将预先计算好的盒图统计信息传递给盒图抽屉。第一个图演示了如何删除和添加单个组件(注意,平均值是默认情况下未显示的唯一值)。第二个图展示了如何定制艺术家的风格。
关于箱线图及其历史的一个很好的一般参考资料可以在这里找到:http://vita.had.co.nz/papers/boxplots.pdf
import numpy as np
import matplotlib.pyplot as plt
import matplotlib.cbook as cbook

# fake data
np.random.seed(19680801)
data = np.random.lognormal(size=(37, 4), mean=1.5, sigma=1.75)
labels = list('ABCD')

# compute the boxplot stats
stats = cbook.boxplot_stats(data, labels=labels, bootstrap=10000)
在我们计算了统计数据之后,我们就可以进行修改了。为了证明这一点,我将把每组数据的中值设置为所有数据的中值,并将平均值加倍
出:
['label', 'mean', 'iqr', 'cilo', 'cihi', 'whishi', 'whislo', 'fliers', 'q1', 'med', 'q3']
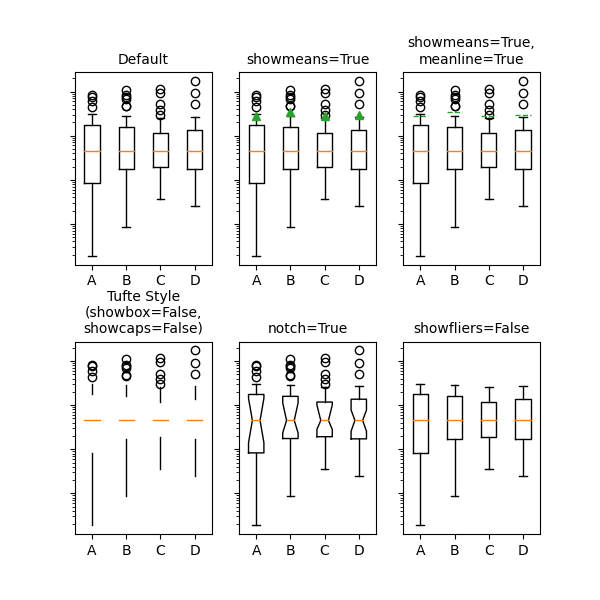
演示如何切换不同元素的显示:
fig, axs = plt.subplots(nrows=2, ncols=3, figsize=(6, 6), sharey=True)
axs[0, 0].bxp(stats)
axs[0, 0].set_title('Default', fontsize=fs)

axs[0, 1].bxp(stats, showmeans=True)
axs[0, 1].set_title('showmeans=True', fontsize=fs)

axs[0, 2].bxp(stats, showmeans=True, meanline=True)
axs[0, 2].set_title('showmeans=True,\nmeanline=True', fontsize=fs)

axs[1, 0].bxp(stats, showbox=False, showcaps=False)
tufte_title = 'Tufte Style\n(showbox=False,\nshowcaps=False)'
axs[1, 0].set_title(tufte_title, fontsize=fs)

axs[1, 1].bxp(stats, shownotches=True)
axs[1, 1].set_title('notch=True', fontsize=fs)

axs[1, 2].bxp(stats, showfliers=False)
axs[1, 2].set_title('showfliers=False', fontsize=fs)

for ax in axs.flat:
    ax.set_yscale('log')
    ax.set_yticklabels([])

fig.subplots_adjust(hspace=0.4)
plt.show()
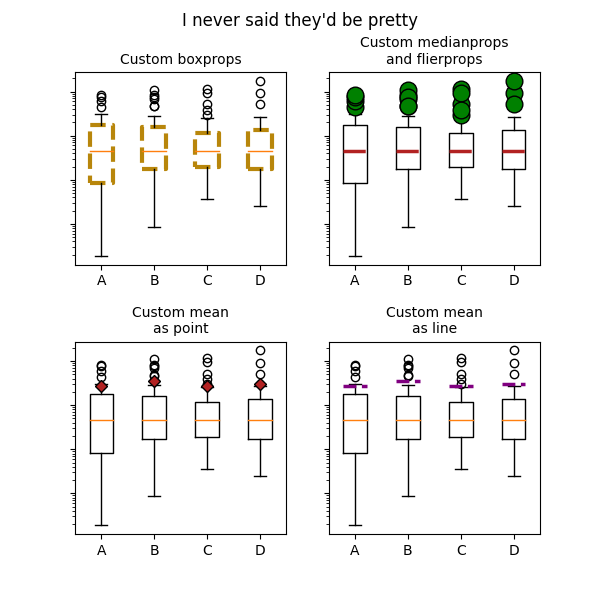
演示如何自定义显示不同元素:
boxprops = dict(linestyle='--', linewidth=3, color='darkgoldenrod')
flierprops = dict(marker='o', markerfacecolor='green', markersize=12,
                  linestyle='none')
medianprops = dict(linestyle='-.', linewidth=2.5, color='firebrick')
meanpointprops = dict(marker='D', markeredgecolor='black',
                      markerfacecolor='firebrick')
meanlineprops = dict(linestyle='--', linewidth=2.5, color='purple')

fig, axs = plt.subplots(nrows=2, ncols=2, figsize=(6, 6), sharey=True)
axs[0, 0].bxp(stats, boxprops=boxprops)
axs[0, 0].set_title('Custom boxprops', fontsize=fs)

axs[0, 1].bxp(stats, flierprops=flierprops, medianprops=medianprops)
axs[0, 1].set_title('Custom medianprops\nand flierprops', fontsize=fs)

axs[1, 0].bxp(stats, meanprops=meanpointprops, meanline=False,
              showmeans=True)
axs[1, 0].set_title('Custom mean\nas point', fontsize=fs)

axs[1, 1].bxp(stats, meanprops=meanlineprops, meanline=True,
              showmeans=True)
axs[1, 1].set_title('Custom mean\nas line', fontsize=fs)

for ax in axs.flat:
    ax.set_yscale('log')
    ax.set_yticklabels([])

fig.suptitle("I never said they'd be pretty")
fig.subplots_adjust(hspace=0.4)
plt.show()
脚本的总运行时间: (0分2.293秒)
关键词:matplotlib代码示例,codex,python plot,pyplot Gallery generated by Sphinx-Gallery