注解
Click here 下载完整的示例代码
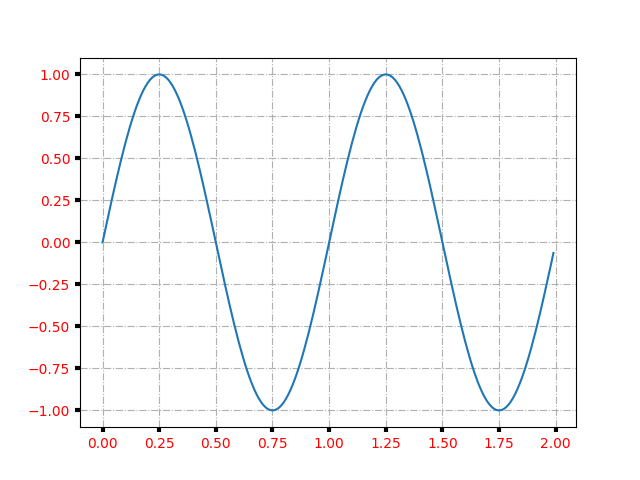
可以控制轴刻度和网格属性
import matplotlib.pyplot as plt
import numpy as np

t = np.arange(0.0, 2.0, 0.01)
s = np.sin(2 * np.pi * t)

fig, ax = plt.subplots()
ax.plot(t, s)

ax.grid(True, linestyle='-.')
ax.tick_params(labelcolor='r', labelsize='medium', width=3)

plt.show()
关键词:matplotlib代码示例,codex,python plot,pyplot Gallery generated by Sphinx-Gallery