注解
Click here 下载完整的示例代码
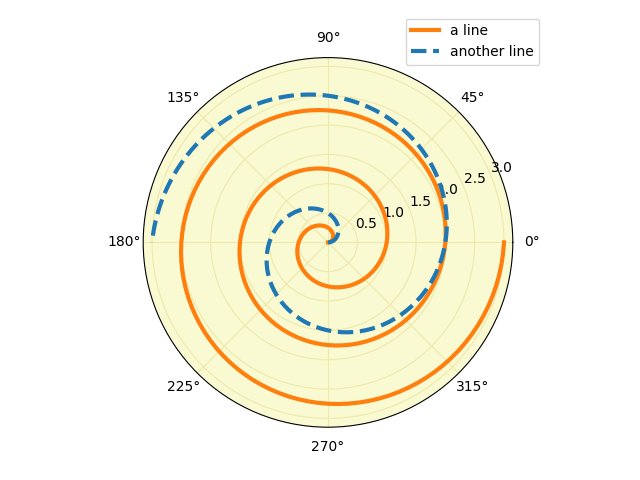
极地传说
极轴图上的图例演示。
import matplotlib.pyplot as plt
import numpy as np

fig = plt.figure()
ax = fig.add_subplot(projection="polar", facecolor="lightgoldenrodyellow")

r = np.linspace(0, 3, 301)
theta = 2 * np.pi * r
ax.plot(theta, r, color="tab:orange", lw=3, label="a line")
ax.plot(0.5 * theta, r, color="tab:blue", ls="--", lw=3, label="another line")
ax.tick_params(grid_color="palegoldenrod")
# For polar axes, it may be useful to move the legend slightly away from the
# axes center, to avoid overlap between the legend and the axes.  The following
# snippet places the legend's lower left corner just outside of the polar axes
# at an angle of 67.5 degrees in polar coordinates.
angle = np.deg2rad(67.5)
ax.legend(loc="lower left",
          bbox_to_anchor=(.5 + np.cos(angle)/2, .5 + np.sin(angle)/2))

plt.show()
工具书类
以下函数、方法、类和模块的使用如本例所示:
关键词:matplotlib代码示例,codex,python plot,pyplot Gallery generated by Sphinx-Gallery