注解
Click here 下载完整的示例代码
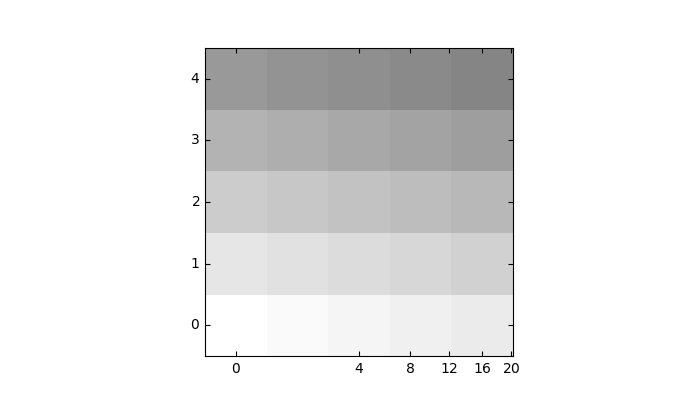
演示曲线网格2
自定义网格和刻度线。
此示例演示如何通过在网格上应用转换来使用GridHelperCurvellinear定义自定义网格和刻度线。作为绘图上的展示,5x5矩阵显示在轴上。
import numpy as np
import matplotlib.pyplot as plt

from mpl_toolkits.axisartist.grid_helper_curvelinear import (
    GridHelperCurveLinear)
from mpl_toolkits.axisartist.grid_finder import (
    ExtremeFinderSimple, MaxNLocator)
from mpl_toolkits.axisartist.axislines import Subplot


def curvelinear_test1(fig):
    """Grid for custom transform."""

    def tr(x, y):
        sgn = np.sign(x)
        x, y = np.abs(np.asarray(x)), np.asarray(y)
        return sgn*x**.5, y

    def inv_tr(x, y):
        sgn = np.sign(x)
        x, y = np.asarray(x), np.asarray(y)
        return sgn*x**2, y

    grid_helper = GridHelperCurveLinear(
        (tr, inv_tr),
        extreme_finder=ExtremeFinderSimple(20, 20),
        # better tick density
        grid_locator1=MaxNLocator(nbins=6), grid_locator2=MaxNLocator(nbins=6))

    ax1 = Subplot(fig, 111, grid_helper=grid_helper)
    # ax1 will have a ticks and gridlines defined by the given
    # transform (+ transData of the Axes). Note that the transform of the Axes
    # itself (i.e., transData) is not affected by the given transform.

    fig.add_subplot(ax1)

    ax1.imshow(np.arange(25).reshape(5, 5),
               vmax=50, cmap=plt.cm.gray_r, origin="lower")


if __name__ == "__main__":
    fig = plt.figure(figsize=(7, 4))
    curvelinear_test1(fig)
    plt.show()
关键词:matplotlib代码示例,codex,python plot,pyplot Gallery generated by Sphinx-Gallery