注解
Click here 下载完整的示例代码
给馅饼和甜甜圈加标签
欢迎来到Matplotlib面包店。我们将通过 pie method 并演示如何用 legend 以及与 annotations .
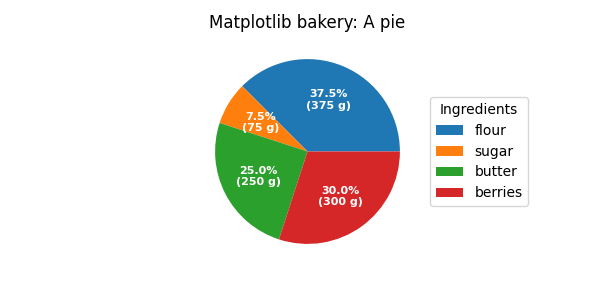
像往常一样,我们会从定义子数据开始创建批量。现在是吃馅饼的时候了。从一个饼图配方开始,我们从中创建数据和标签列表。
我们可以为 autopct 参数,它将通过显示绝对值来扩展自动百分比标记;我们从相对数据和所有值的已知和计算后一个值。
然后,我们创建饼图并存储返回的对象以供以后使用。返回元组的第一个返回元素是一个楔子列表。那些是 matplotlib.patches.Wedge 修补程序,可直接用作图例的句柄。我们可以用传说的 bbox_to_anchor 用于将图例置于饼图外部的参数。这里我们用坐标轴 (1, 0, 0.5, 1) 连同地点 "center left" ;即,图例的左中心点将位于边界框的左中心点,从 (1, 0) 到 (1.5, 1) 在轴坐标中。
import numpy as np
import matplotlib.pyplot as plt

fig, ax = plt.subplots(figsize=(6, 3), subplot_kw=dict(aspect="equal"))

recipe = ["375 g flour",
          "75 g sugar",
          "250 g butter",
          "300 g berries"]

data = [float(x.split()[0]) for x in recipe]
ingredients = [x.split()[-1] for x in recipe]


def func(pct, allvals):
    absolute = int(pct/100.*np.sum(allvals))
    return "{:.1f}%\n({:d} g)".format(pct, absolute)


wedges, texts, autotexts = ax.pie(data, autopct=lambda pct: func(pct, data),
                                  textprops=dict(color="w"))

ax.legend(wedges, ingredients,
          title="Ingredients",
          loc="center left",
          bbox_to_anchor=(1, 0, 0.5, 1))

plt.setp(autotexts, size=8, weight="bold")

ax.set_title("Matplotlib bakery: A pie")

plt.show()
现在是吃甜甜圈的时候了。从一个甜甜圈食谱开始,我们将数据转录成数字(将1个鸡蛋转换成50克),然后直接绘制饼图。馅饼?等待。。。它将是甜甜圈,不是吗?嗯,正如我们在这里看到的,甜甜圈是一个馅饼,有一个 width 设置为与半径不同的楔块。这很容易。这是通过 wedgeprops 参数。
然后我们想通过 annotations . 我们首先创建一些具有公共属性的字典,稍后可以将其作为关键字参数传递。然后我们迭代所有的楔子和
- 计算楔形中心的角度,
- 从这一点得到圆周上该角点的坐标,
- 根据点位于圆的哪一侧,确定文本的水平对齐方式,
- 用获得的角度更新连接样式,使注释箭头点从甜甜圈向外,
- 最后,使用先前确定的所有参数创建注释。
fig, ax = plt.subplots(figsize=(6, 3), subplot_kw=dict(aspect="equal"))

recipe = ["225 g flour",
          "90 g sugar",
          "1 egg",
          "60 g butter",
          "100 ml milk",
          "1/2 package of yeast"]

data = [225, 90, 50, 60, 100, 5]

wedges, texts = ax.pie(data, wedgeprops=dict(width=0.5), startangle=-40)

bbox_props = dict(boxstyle="square,pad=0.3", fc="w", ec="k", lw=0.72)
kw = dict(arrowprops=dict(arrowstyle="-"),
          bbox=bbox_props, zorder=0, va="center")

for i, p in enumerate(wedges):
    ang = (p.theta2 - p.theta1)/2. + p.theta1
    y = np.sin(np.deg2rad(ang))
    x = np.cos(np.deg2rad(ang))
    horizontalalignment = {-1: "right", 1: "left"}[int(np.sign(x))]
    connectionstyle = "angle,angleA=0,angleB={}".format(ang)
    kw["arrowprops"].update({"connectionstyle": connectionstyle})
    ax.annotate(recipe[i], xy=(x, y), xytext=(1.35*np.sign(x), 1.4*y),
                horizontalalignment=horizontalalignment, **kw)

ax.set_title("Matplotlib bakery: A donut")

plt.show()
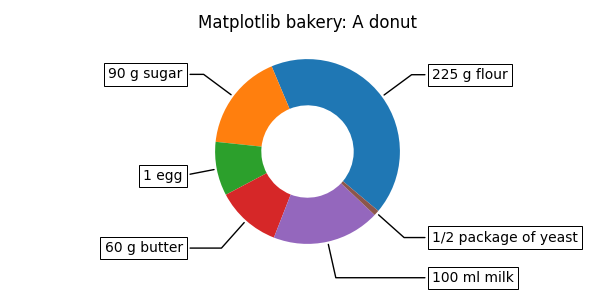
这是甜甜圈。但是要注意的是,如果我们使用这个食谱,这些配料就足够制作6个甜甜圈了——一个巨大的甜甜圈还没有经过测试,可能会导致厨房出错。
工具书类
以下函数、方法、类和模块的使用如本例所示:
出:
<function legend at 0x7faa00cfaa60>
关键词:matplotlib代码示例,codex,python plot,pyplot Gallery generated by Sphinx-Gallery