注解
Click here 下载完整的示例代码
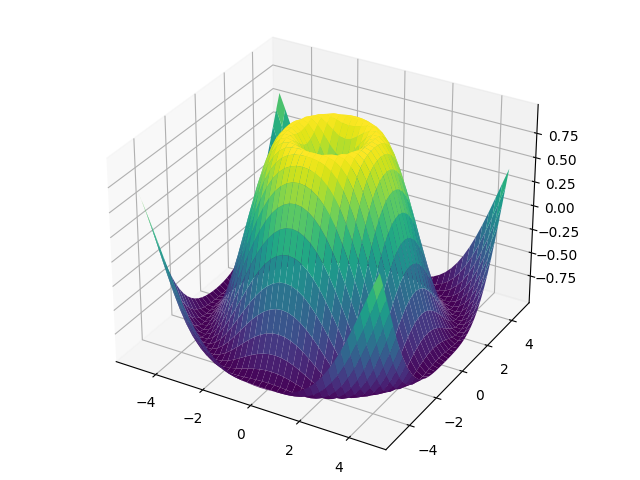
新增功能0.99 Mplot3d
创建三维曲面图。
import numpy as np
import matplotlib.pyplot as plt
from matplotlib import cm
from mpl_toolkits.mplot3d import Axes3D

X = np.arange(-5, 5, 0.25)
Y = np.arange(-5, 5, 0.25)
X, Y = np.meshgrid(X, Y)
R = np.sqrt(X**2 + Y**2)
Z = np.sin(R)

fig = plt.figure()
ax = Axes3D(fig)
ax.plot_surface(X, Y, Z, rstride=1, cstride=1, cmap=cm.viridis)

plt.show()
工具书类
以下函数、方法、类和模块的使用如本例所示:
import mpl_toolkits
mpl_toolkits.mplot3d.Axes3D
mpl_toolkits.mplot3d.Axes3D.plot_surface
出:
<function Axes3D.plot_surface at 0x7faa00d541e0>
关键词:matplotlib代码示例,codex,python plot,pyplot Gallery generated by Sphinx-Gallery