LearningCurveDisplay#
- class sklearn.model_selection.LearningCurveDisplay(*, train_sizes, train_scores, test_scores, score_name=None)[源代码]#
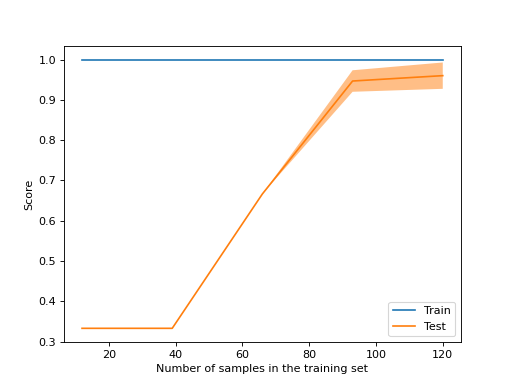
学习曲线可视化。
It is recommended to use
from_estimatorto create aLearningCurveDisplayinstance. All parameters are stored as attributes.阅读更多的 User Guide 有关可视化API的一般信息和 detailed documentation 关于学习曲线可视化。
Added in version 1.2.
- 参数:
- train_sizes形状的nd数组(n_unique_ticks,)
用于生成学习曲线的训练示例的数量。
- train_scores形状的ndarray(n_ticks,n_cv_folds)
Scores on training sets.
- test_scores形状的ndarray(n_ticks,n_cv_folds)
测试集上的分数。
- score_name字符串,默认=无
使用的乐谱名称
learning_curve. It will override the name inferred from thescoringparameter. IfscoreisNone, we use"Score"ifnegate_scoreisFalseand"Negative score"otherwise. Ifscoringis a string or a callable, we infer the name. We replace_ '用空白并大写第一个字母。我们删除 `neg_并将其替换为"Negative"如果negate_score是False或者只是将其删除,否则。
- 属性:
- ax_matplotlib轴
Axes with the learning curve.
- figure_matplotlib图
包含学习曲线的图。
- errorbar_matplotlib艺术家或无列表
当
std_display_style是"errorbar",这是一个列表matplotlib.container.ErrorbarContainer对象如果使用其他风格,errorbar_是None.- lines_matplotlib艺术家或无列表
当
std_display_style是"fill_between",这是一个列表matplotlib.lines.Line2D对应于平均训练和测试分数的对象。如果使用其他风格,line_是None.- fill_between_matplotlib艺术家或无列表
当
std_display_style是"fill_between",这是一个列表matplotlib.collections.PolyCollection对象如果使用其他风格,fill_between_是None.
参见
示例
>>> import matplotlib.pyplot as plt
>>> from sklearn.datasets import load_iris
>>> from sklearn.model_selection import LearningCurveDisplay, learning_curve
>>> from sklearn.tree import DecisionTreeClassifier
>>> X, y = load_iris(return_X_y=True)
>>> tree = DecisionTreeClassifier(random_state=0)
>>> train_sizes, train_scores, test_scores = learning_curve(
...     tree, X, y)
>>> display = LearningCurveDisplay(train_sizes=train_sizes,
...     train_scores=train_scores, test_scores=test_scores, score_name="Score")
>>> display.plot()
<...>
>>> plt.show()
- classmethod from_estimator(estimator, X, y, *, groups=None, train_sizes=array([0.1, 0.325, 0.55, 0.775, 1.]), cv=None, scoring=None, exploit_incremental_learning=False, n_jobs=None, pre_dispatch='all', verbose=0, shuffle=False, random_state=None, error_score=nan, fit_params=None, ax=None, negate_score=False, score_name=None, score_type='both', std_display_style='fill_between', line_kw=None, fill_between_kw=None, errorbar_kw=None)[源代码]#
从估计器创建学习曲线显示。
阅读更多的 User Guide 有关可视化API的一般信息和 detailed documentation 关于学习曲线可视化。
- 参数:
- estimator实现“fit”和“predict”方法的对象类型
为每次验证而克隆的该类型的对象。
- X形状类似阵列(n_samples,n_features)
训练数据,在哪里
n_samples是样本数量和n_features是功能的数量。- y形状的类似阵列(n_samples,)或(n_samples,n_outputs)或无
用于分类或回归的目标相对于X;无监督学习。
- groups形状类似数组(n_samples,),默认=无
Group labels for the samples used while splitting the dataset into train/test set. Only used in conjunction with a "Group" cv instance (e.g.,
GroupKFold).- train_sizes形状类似数组(n_ticks,), 默认=NP.linSpace(0.1,1.0,5)
将用于生成学习曲线的训练示例的相对或绝对数量。如果dype是float,则它被视为训练集最大大小(由所选验证方法确定)的一小部分,即它必须在(0,1]内。否则,它被解释为训练集的绝对大小。请注意,对于分类,样本数量通常必须足够大,以包含每个类别的至少一个样本。
- cvint,交叉验证生成器或可迭代对象,默认=无
确定交叉验证拆分策略。简历的可能输入包括:
无,要使用默认的5重交叉验证,
int,指定中的折叠数
(Stratified)KFold,可迭代产出(训练、测试)分裂为索引数组。
对于int/No输入,如果估计器是分类器并且
y是二元或多类,StratifiedKFold采用了在所有其他情况下,KFold采用了这些拆分器实例化为shuffle=False因此不同呼叫之间的拆分将是相同的。指 User Guide 这里可以使用的各种交叉验证策略。
- scoring字符串或可调用,默认=无
字符串(请参阅 的 scoring 参数:定义模型评估规则 )或具有签名的记分器可调用对象/函数
scorer(estimator, X, y)(见 可召唤得分手 ).- exploit_incremental_learning布尔,默认=假
如果估计器支持增量学习,则这将用于加快对不同训练集大小的匹配。
- n_jobsint,默认=无
要并行运行的作业数。训练估计器和计算分数在不同的训练和测试集中并行进行。
None意思是1,除非在a中joblib.parallel_backend上下文-1意味着使用所有处理器。看到 Glossary 了解更多详细信息。- pre_dispatchint或url,默认=' all '
并行执行的预调度作业数(默认值为all)。该选项可以减少分配的内存。str可以是像'2*n_jobs'这样的表达式。
- verboseint,默认=0
控制详细程度:越高,消息越多。
- shuffle布尔,默认=假
是否在根据“train_sizes”获取训练数据的开头之前对训练数据进行洗牌。
- random_stateint,RandomState实例或无,默认=无
时使用
shuffle是真的传递一个int值,以便在多个函数调用中获得可重复的输出。看到 Glossary .- error_score“raise”或数字,默认=NP.nan
如果估计量匹配中出现错误,则指定给分数的值。如果设置为“raise”,则会引发错误。如果给出了数字值,则会引发FitUtiledWarning。
- fit_paramsdict,默认=无
要传递给估计器的匹配方法的参数。
- axmatplotlib轴,默认=无
轴反对绘图。如果
None,创建新图形和轴。- negate_score布尔,默认=假
是否否定通过获得的分数
learning_curve.当使用由neg_*在scikit-learn.- score_name字符串,默认=无
用于装饰情节y轴的乐谱名称。它将覆盖从
scoringparameter. IfscoreisNone, we use"Score"ifnegate_scoreisFalseand"Negative score"otherwise. Ifscoringis a string or a callable, we infer the name. We replace_ '用空白并大写第一个字母。我们删除 `neg_并将其替换为"Negative"如果negate_score是False或者只是将其删除,否则。- score_type{“测试”,“train”,“both”},默认=“both”
要绘制的乐谱类型。可以是一个
"test","train",或者"both".- std_display_style{“errorbar”,“fill_between”}或无,默认值=“fill_between”
用于显示平均分数周围的分数标准差的样式。如果
None,不显示标准差的表示。- line_kwdict,默认=无
其他关键字参数传递给
plt.plot用于绘制平均分。- fill_between_kwdict,默认=无
其他关键字参数传递给
plt.fill_between用于绘制分数标准差。- errorbar_kwdict,默认=无
其他关键字参数传递给
plt.errorbar用于绘制平均分和标准差分。
- 返回:
- display :
LearningCurveDisplayLearningCurveDisplay 存储计算值的对象。
- display :
示例
>>> import matplotlib.pyplot as plt
>>> from sklearn.datasets import load_iris
>>> from sklearn.model_selection import LearningCurveDisplay
>>> from sklearn.tree import DecisionTreeClassifier
>>> X, y = load_iris(return_X_y=True)
>>> tree = DecisionTreeClassifier(random_state=0)
>>> LearningCurveDisplay.from_estimator(tree, X, y)
<...>
>>> plt.show()

- plot(ax=None, *, negate_score=False, score_name=None, score_type='both', std_display_style='fill_between', line_kw=None, fill_between_kw=None, errorbar_kw=None)[源代码]#
情节可视化。
- 参数:
- axmatplotlib轴,默认=无
轴反对绘图。如果
None,创建新图形和轴。- negate_score布尔,默认=假
是否否定通过获得的分数
learning_curve.当使用由neg_*在scikit-learn.- score_name字符串,默认=无
用于装饰情节y轴的乐谱名称。它将覆盖从
scoringparameter. IfscoreisNone, we use"Score"ifnegate_scoreisFalseand"Negative score"otherwise. Ifscoringis a string or a callable, we infer the name. We replace_ '用空白并大写第一个字母。我们删除 `neg_并将其替换为"Negative"如果negate_score是False或者只是将其删除,否则。- score_type{“测试”,“train”,“both”},默认=“both”
要绘制的乐谱类型。可以是一个
"test","train",或者"both".- std_display_style{“errorbar”,“fill_between”}或无,默认值=“fill_between”
用于显示平均分数周围的分数标准差的样式。如果无,则不显示标准差表示。
- line_kwdict,默认=无
其他关键字参数传递给
plt.plot用于绘制平均分。- fill_between_kwdict,默认=无
其他关键字参数传递给
plt.fill_between用于绘制分数标准差。- errorbar_kwdict,默认=无
其他关键字参数传递给
plt.errorbar用于绘制平均分和标准差分。
- 返回:
- display :
LearningCurveDisplayLearningCurveDisplay 存储计算值的对象。
- display :