CalibrationDisplay#
- class sklearn.calibration.CalibrationDisplay(prob_true, prob_pred, y_prob, *, estimator_name=None, pos_label=None)[源代码]#
Calibration curve (also known as reliability diagram) visualization.
It is recommended to use
from_estimatororfrom_predictionsto create aCalibrationDisplay. All parameters are stored as attributes.有关校准的更多信息,请参阅 User Guide 以及有关scikit-learn可视化API的更多信息 可视化 .
有关如何使用可视化的示例,请参阅 概率校准曲线 .
Added in version 1.0.
- 参数:
- prob_true形状的nd数组(n_bins,)
每个箱中类别为阳性类别(阳性分数)的样本比例。
- prob_pred形状的nd数组(n_bins,)
每个箱中的平均预测概率。
- y_prob形状的nd数组(n_samples,)
每个样本的阳性类别的概率估计。
- estimator_name字符串,默认=无
估算者姓名。如果无,则不会显示估计器名称。
- pos_labelint、float、bool或string,默认值为无
The positive class when computing the calibration curve. By default,
pos_labelis set toestimators.classes_[1]when usingfrom_estimatorand set to 1 when usingfrom_predictions.Added in version 1.1.
- 属性:
- line_matplotlib艺术家
校准曲线。
- ax_matplotlib轴
带有校准曲线的轴。
- figure_matplotlib图
包含曲线的图形。
参见
calibration_curve计算校准曲线的真实概率和预测概率。
CalibrationDisplay.from_predictions使用真实和预测标签绘制校准曲线。
CalibrationDisplay.from_estimator使用估计器和数据绘制校准曲线。
示例
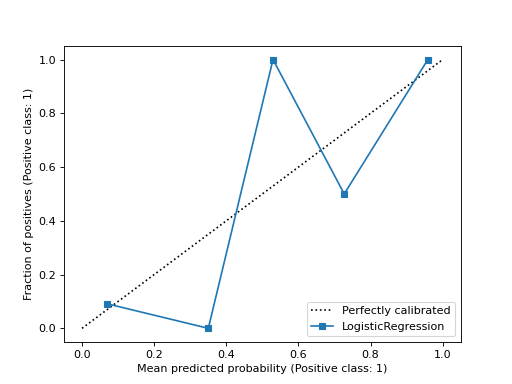
>>> from sklearn.datasets import make_classification
>>> from sklearn.model_selection import train_test_split
>>> from sklearn.linear_model import LogisticRegression
>>> from sklearn.calibration import calibration_curve, CalibrationDisplay
>>> X, y = make_classification(random_state=0)
>>> X_train, X_test, y_train, y_test = train_test_split(
...     X, y, random_state=0)
>>> clf = LogisticRegression(random_state=0)
>>> clf.fit(X_train, y_train)
LogisticRegression(random_state=0)
>>> y_prob = clf.predict_proba(X_test)[:, 1]
>>> prob_true, prob_pred = calibration_curve(y_test, y_prob, n_bins=10)
>>> disp = CalibrationDisplay(prob_true, prob_pred, y_prob)
>>> disp.plot()
<...>
- classmethod from_estimator(estimator, X, y, *, n_bins=5, strategy='uniform', pos_label=None, name=None, ref_line=True, ax=None, **kwargs)[源代码]#
使用二元分类器和数据绘制校准曲线。
校准曲线(也称为可靠性图)使用来自二进制分类器的输入,并在y轴上绘制每个箱的平均预测概率相对于阳性类别的分数。
额外的关键字参数将传递给
matplotlib.pyplot.plot.有关校准的更多信息,请参阅 User Guide 以及有关scikit-learn可视化API的更多信息 可视化 .
Added in version 1.0.
- 参数:
- estimator估计器实例
安装分类器或安装
Pipeline其中最后一个估计器是分类器。分类器必须有 predict_proba 法- X形状(n_samples,n_features)的{类数组,稀疏矩阵}
输入值。
- y形状类似阵列(n_samples,)
二进制目标值。
- n_binsint,默认=5
要离散化的箱数 [0, 1] 计算校准曲线时的间隔。更大的数字需要更多的数据。
- strategy' unique ','分位数',默认=' unique '
用于定义箱宽度的策略。
'uniform': The bins have identical widths.'quantile':箱具有相同数量的样本并取决于预测概率。
- pos_labelint、float、bool或string,默认值为无
The positive class when computing the calibration curve. By default,
estimators.classes_[1]is considered as the positive class.Added in version 1.1.
- name字符串,默认=无
标记曲线的名称。如果
None,使用估计器的名称。- ref_line布尔,默认=True
如果
True绘制了表示完美校准的分类器的参考线。- axmatplotlib轴,默认=无
轴反对绘图。如果
None,创建新图形和轴。- **kwargsdict
要传递给的关键字参数
matplotlib.pyplot.plot.
- 返回:
- display :
CalibrationDisplay.校准显示。 存储计算值的对象。
- display :
参见
CalibrationDisplay.from_predictions使用真实和预测标签绘制校准曲线。
示例
>>> import matplotlib.pyplot as plt
>>> from sklearn.datasets import make_classification
>>> from sklearn.model_selection import train_test_split
>>> from sklearn.linear_model import LogisticRegression
>>> from sklearn.calibration import CalibrationDisplay
>>> X, y = make_classification(random_state=0)
>>> X_train, X_test, y_train, y_test = train_test_split(
...     X, y, random_state=0)
>>> clf = LogisticRegression(random_state=0)
>>> clf.fit(X_train, y_train)
LogisticRegression(random_state=0)
>>> disp = CalibrationDisplay.from_estimator(clf, X_test, y_test)
>>> plt.show()
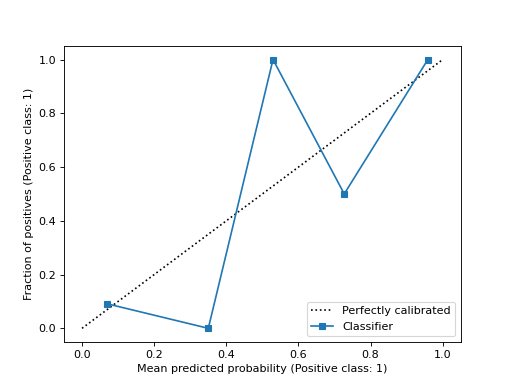
- classmethod from_predictions(y_true, y_prob, *, n_bins=5, strategy='uniform', pos_label=None, name=None, ref_line=True, ax=None, **kwargs)[源代码]#
Plot calibration curve using true labels and predicted probabilities.
校准曲线(也称为可靠性图)使用来自二进制分类器的输入,并在y轴上绘制每个箱的平均预测概率与阳性类别的比例。
额外的关键字参数将传递给
matplotlib.pyplot.plot.有关校准的更多信息,请参阅 User Guide 以及有关scikit-learn可视化API的更多信息 可视化 .
Added in version 1.0.
- 参数:
- y_true形状类似阵列(n_samples,)
真正的标签。
- y_prob形状类似阵列(n_samples,)
阳性类别的预测概率。
- n_binsint,默认=5
要离散化的箱数 [0, 1] 计算校准曲线时的间隔。更大的数字需要更多的数据。
- strategy' unique ','分位数',默认=' unique '
用于定义箱宽度的策略。
'uniform': The bins have identical widths.'quantile':箱具有相同数量的样本并取决于预测概率。
- pos_labelint、float、bool或string,默认值为无
计算校准曲线时的正值类别。默认情况下
pos_label设置为1。Added in version 1.1.
- name字符串,默认=无
标记曲线的名称。
- ref_line布尔,默认=True
如果
True绘制了表示完美校准的分类器的参考线。- axmatplotlib轴,默认=无
轴反对绘图。如果
None,创建新图形和轴。- **kwargsdict
要传递给的关键字参数
matplotlib.pyplot.plot.
- 返回:
- display :
CalibrationDisplay.校准显示。 存储计算值的对象。
- display :
参见
CalibrationDisplay.from_estimator使用估计器和数据绘制校准曲线。
示例
>>> import matplotlib.pyplot as plt
>>> from sklearn.datasets import make_classification
>>> from sklearn.model_selection import train_test_split
>>> from sklearn.linear_model import LogisticRegression
>>> from sklearn.calibration import CalibrationDisplay
>>> X, y = make_classification(random_state=0)
>>> X_train, X_test, y_train, y_test = train_test_split(
...     X, y, random_state=0)
>>> clf = LogisticRegression(random_state=0)
>>> clf.fit(X_train, y_train)
LogisticRegression(random_state=0)
>>> y_prob = clf.predict_proba(X_test)[:, 1]
>>> disp = CalibrationDisplay.from_predictions(y_test, y_prob)
>>> plt.show()
- plot(*, ax=None, name=None, ref_line=True, **kwargs)[源代码]#
情节可视化。
额外的关键字参数将传递给
matplotlib.pyplot.plot.- 参数:
- axMatplotlib轴,默认=无
轴反对绘图。如果
None,创建新图形和轴。- name字符串,默认=无
标记曲线的名称。如果
None,使用estimator_name如果不是None否则不显示标记。- ref_line布尔,默认=True
如果
True绘制了表示完美校准的分类器的参考线。- **kwargsdict
要传递给的关键字参数
matplotlib.pyplot.plot.
- 返回:
- display :
CalibrationDisplayCalibrationDisplay 存储计算值的对象。
- display :