>>> from env_helper import info; info()
页面更新时间: 2023-06-24 11:23:20
运行环境:
    Linux发行版本: Debian GNU/Linux 12 (bookworm)
    操作系统内核: Linux-6.1.0-9-amd64-x86_64-with-glibc2.36
    Python版本: 3.11.2
1.2. 开始使用 OpenCV
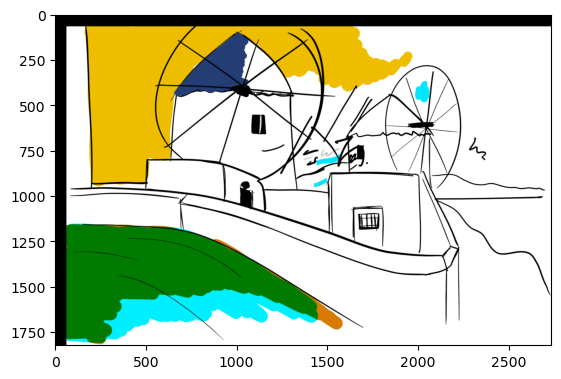
>>> import cv2
>>> img=cv2.imread('foo.png')
>>> from IPython.display import Image
>>> import numpy as np
>>> from matplotlib import pyplot as plt
>>>
>>> plt.imshow(img )
>>> plt.xticks = []
>>> plt.yticks = []
>>> plt.show()
>>>
>>>
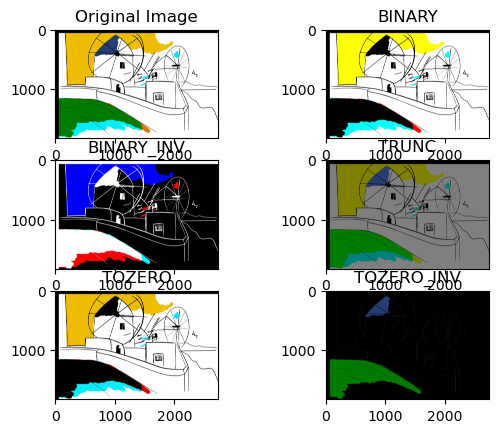
>>> # img = cv2.imread('gradient.png',0)
>>> ret,thresh1 = cv2.threshold(img,127,255,cv2.THRESH_BINARY)
>>> ret,thresh2 = cv2.threshold(img,127,255,cv2.THRESH_BINARY_INV)
>>> ret,thresh3 = cv2.threshold(img,127,255,cv2.THRESH_TRUNC)
>>> ret,thresh4 = cv2.threshold(img,127,255,cv2.THRESH_TOZERO)
>>> ret,thresh5 = cv2.threshold(img,127,255,cv2.THRESH_TOZERO_INV)
>>>
>>> titles = ['Original Image','BINARY','BINARY_INV','TRUNC','TOZERO','TOZERO_INV']
>>> images = [img, thresh1, thresh2, thresh3, thresh4, thresh5]
>>>
>>> for i in range(6):
>>> plt.subplot(3,2,i+1),plt.imshow(images[i],'gray')
>>> plt.title(titles[i])
>>> plt.xticks = []
>>> plt.yticks = []
>>>
>>> plt.show()
>>>
>>> import numpy as np
>>> from matplotlib import pyplot as plt
>>>
>>>
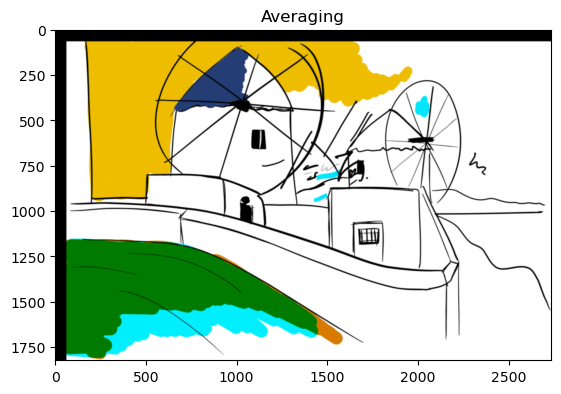
>>> kernel = np.ones((5,5),np.float32)/25
>>> dst = cv2.filter2D(img,-1,kernel)
>>>
>>> plt.subplot(111),plt.imshow(img),plt.title('Original')
>>> plt.xticks = []
>>> plt.yticks = []
>>> plt.show()
>>> plt.subplot(111),plt.imshow(dst),plt.title('Averaging')
>>> plt.xticks = []
>>> plt.yticks = []
>>> plt.show()

>>> # import cv2
>>> # import numpy as np
>>> # from matplotlib import pyplot as plt
>>>
>>> # img = cv2.imread('noisy2.png',0)
>>>
>>> # global thresholding
>>> ret1,th1 = cv2.threshold(img,127,255,cv2.THRESH_BINARY)
>>>
>>> # Otsu's thresholding
>>> ret2,th2 = cv2.threshold(img,0,255,cv2.THRESH_BINARY+cv2.THRESH_OTSU)
>>>
>>> # Otsu's thresholding after Gaussian filtering
>>> blur = cv2.GaussianBlur(img,(5,5),0)
>>> ret3,th3 = cv2.threshold(blur,0,255,cv2.THRESH_BINARY+cv2.THRESH_OTSU)
>>>
>>> # plot all the images and their histograms
>>> images = [img, 0, th1,
>>>           img, 0, th2,
>>>           blur, 0, th3]
>>> titles = ['Original Noisy Image','Histogram','Global Thresholding (v=127)',
>>>           'Original Noisy Image','Histogram',"Otsu's Thresholding",
>>>           'Gaussian filtered Image','Histogram',"Otsu's Thresholding"]
>>>
>>> for i in xrange(3):
>>>     plt.subplot(3,3,i*3+1),plt.imshow(images[i*3],'gray')
>>>     plt.title(titles[i*3]), plt.xticks([]), plt.yticks([])
>>>     plt.subplot(3,3,i*3+2),plt.hist(images[i*3].ravel(),256)
>>>     plt.title(titles[i*3+1]), plt.xticks([]), plt.yticks([])
>>>     plt.subplot(3,3,i*3+3),plt.imshow(images[i*3+2],'gray')
>>>     plt.title(titles[i*3+2]), plt.xticks([]), plt.yticks([])
>>> plt.show()
---------------------------------------------------------------------------

error                                     Traceback (most recent call last)

Cell In [7], line 11
      8 ret1,th1 = cv2.threshold(img,127,255,cv2.THRESH_BINARY)
     10 # Otsu's thresholding
---> 11 ret2,th2 = cv2.threshold(img,0,255,cv2.THRESH_BINARY+cv2.THRESH_OTSU)
     13 # Otsu's thresholding after Gaussian filtering
     14 blur = cv2.GaussianBlur(img,(5,5),0)


error: OpenCV(4.6.0) ./modules/imgproc/src/thresh.cpp:1555: error: (-2:Unspecified error) in function 'double cv::threshold(InputArray, OutputArray, double, double, int)'
> THRESH_OTSU mode:
>     'src_type == CV_8UC1 || src_type == CV_16UC1'
> where
>     'src_type' is 16 (CV_8UC3)