>>> from env_helper import info; info()
页面更新时间: 2024-01-20 20:33:16
运行环境:
    Linux发行版本: Debian GNU/Linux 12 (bookworm)
    操作系统内核: Linux-6.1.0-17-amd64-x86_64-with-glibc2.36
    Python版本: 3.11.2
4.3. 绘图配置参数
一幅图有许多需要配置的属性,例如颜色、字体、线型等等。 绘图时并不需要对这些属性进行配置,许多都直接采用了Matplotlib的缺省参数值。 Matplotlib将缺省配置保存在一个文件中,通过更改这个文件可以修改这些属性的缺省值。 Matplotlib 使用配置文件 matplotlibrc 时的搜索顺序如下:
当前路径 : 程序的当前路径
用户配置路径 : 通常为
$HOME/.matplotlib/,可以通过环境变量MATPLOTLIBRC修改系统配置路径 : 保存在 matplotlib 的安装目录下的
mpl-data下
通过下面的语句可以获取用户配置路径:
>>> import matplotlib
>>> matplotlib.get_configdir()
'/home/bk/.config/matplotlib'
通过下面的语句可以获得目前使用的配置文件的路径:
>>> import matplotlib
>>> matplotlib.matplotlib_fname()
'/etc/matplotlibrc'
由于在当前路径和用户配置路径中都没有找到位置文件,因此最后使用的是系统配置路径下的配置文 件。如果你将matplotlibrc复制一份到脚本的当前目录下:
>>> import os
>>> os.getcwd()
'/home/bk/book-jubook/python/jubook_python/pt07_scicomputation/ch04_matplotlib'
复制配置文件之后再运行:
>>> matplotlib.matplotlib_fname()
'/etc/matplotlibrc'
如果你用文本编辑器打开此配置文件的话,你会发现它实际上是定义了一个字典。
为了对众多的配置进行区分,关键字可以用点分开。 配置文件的读入可以使用
rc_params() 函数,它返回一个配置字典:
>>> rc_params = matplotlib.rc_params()
>>> type(rc_params)
matplotlib.RcParams
打印一些参数看一下:
>>> for key in rc_params:
>>>     if 'axes.label' in key:
>>>         print(f'{key}: {rc_params[key]}')
axes.labelcolor: black
axes.labelpad: 4.0
axes.labelsize: medium
axes.labelweight: normal
在 matplotlib 模块载入的时候会调用 rc_params()
,并把得到的配置字典保存到 rcParams 变量中:
>>> for key in matplotlib.rcParams:
>>>     if 'axes.label' in key:
>>>         print(f'{key}: {rc_params[key]}')
axes.labelcolor: black
axes.labelpad: 4.0
axes.labelsize: medium
axes.labelweight: normal
4.3.1. 更改配置信息
matplotlib将使用 rcParams 中的配置进行绘图。
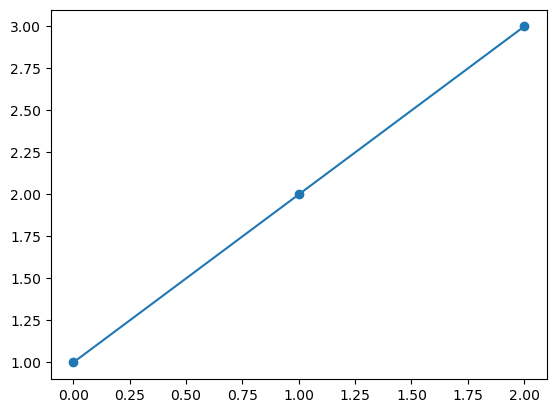
用户可以直接修改此字典中的配置,所做的改变会反
映到此后所绘制的图中。例如下面的脚本所绘制的线将带有圆形的点标识符:
>>> matplotlib.rcParams["lines.marker"] = "o"
>>> import pylab
>>> pylab.plot([1,2,3])
>>> pylab.show()
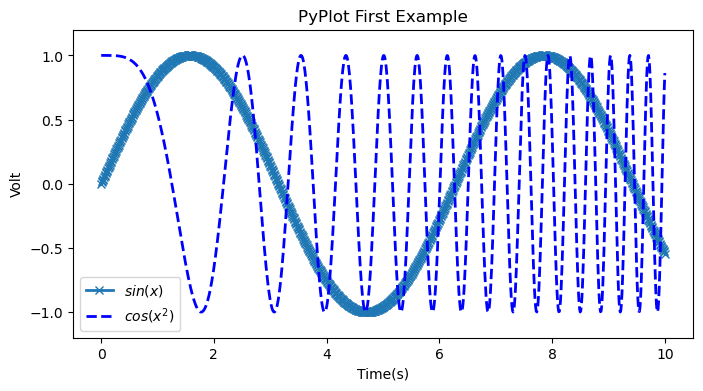
为了方便配置,可以使用rc函数,下面的例子同时配置点标识符、线宽和颜色:
>>> matplotlib.rc("lines", marker="x", linewidth=2, color="white")
基于上面的配置,进行绘图:
>>> %matplotlib inline
>>>
>>> import numpy as np
>>> import matplotlib.pyplot as plt
>>> x = np.linspace(0, 10, 1000)
>>> y = np.sin(x)
>>> z = np.cos(x**2)
>>> plt.figure(figsize=(8,4))
>>> plt.plot(x,y,label="$sin(x)$")
>>> plt.plot(x,z,"b--",label="$cos(x^2)$")
>>> plt.xlabel("Time(s)")
>>> plt.ylabel("Volt")
>>> plt.title("PyPlot First Example")
>>> plt.ylim(-1.2,1.2)
>>> plt.legend()
>>> plt.show()
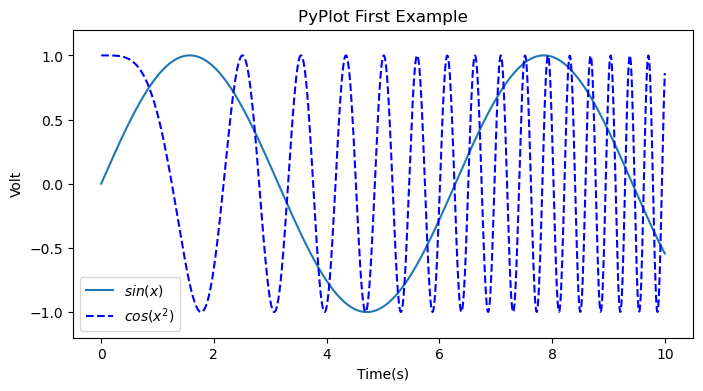
4.3.2. 恢复配置信息
如果希望恢复到缺省的配置(matplotlib载入时从配置文件读入的配置)的话,
可以调用 rcdefaults() 函数。
>>> matplotlib.rcdefaults()
>>> # import numpy as np
>>> # import matplotlib.pyplot as plt
>>> x = np.linspace(0, 10, 1000)
>>> y = np.sin(x)
>>> z = np.cos(x**2)
>>> plt.figure(figsize=(8,4))
>>> plt.plot(x,y,label="$sin(x)$")
>>> plt.plot(x,z,"b--",label="$cos(x^2)$")
>>> plt.xlabel("Time(s)")
>>> plt.ylabel("Volt")
>>> plt.title("PyPlot First Example")
>>> plt.ylim(-1.2,1.2)
>>> plt.legend()
>>> plt.show()
如果手工修改了配置文件,希望重新从配置文件载入最新的配置的话,可以调用:
>>> matplotlib.rcParams.update( matplotlib.rc_params() )