>>> from env_helper import info; info()
页面更新时间: 2024-07-13 09:19:01
运行环境:
    Linux发行版本: Debian GNU/Linux 12 (bookworm)
    操作系统内核: Linux-6.1.0-22-amd64-x86_64-with-glibc2.36
    Python版本: 3.11.2
4.7. 使用reportlab模块
模块默认不支持中文,如果使用中文需要注册,他并不算是真正的开源库。 我们虽然不能用它读取PDF,但是可以画图、画表格、编辑文字,最后可以输出PDF格式。
安装
pip3 install reportlab
在 Debian 12 中,可以通过软件仓储库进行安装:
sudo apt install python3-reportlab
4.7.1. 生成文字
前面我们生成水印时已经使用过了。
>>> from reportlab.lib.styles import getSampleStyleSheet
>>> from reportlab.platypus import Paragraph,SimpleDocTemplate
>>> from reportlab.lib import  colors
>>>
>>> Style=getSampleStyleSheet()
字体的样式,大小
>>> bt = Style['Normal']
>>> bt.fontSize=14
设置分词
>>> bt.wordWrap = 'CJK'
设置行距和缩进
>>> bt.firstLineIndent = 32
>>> bt.leading = 20
这是位置和颜色
>>> bt.alignment=1
>>> bt.textColor = colors.red
>>>
>>> t = Paragraph('hello',bt)
>>> pdf=SimpleDocTemplate('./xx_ppff.pdf')
>>> pdf.multiBuild([t])
1
4.7.2. 生成表格
与生成文字相似,不过要多几个方法
>>> from reportlab.lib.colors import HexColor
>>> from reportlab.platypus import  Table,TableStyle
>>> from reportlab.lib.units import inch
>>>
>>> Style=getSampleStyleSheet()
>>> n = Style['Normal']
>>> data = [[0,1,2,3,4,5,6,7],[0,1,2,3,4,5,6,7],[0,1,2,3,4,5,6,7],[0,1,2,3,4,5,6,7],]
设置表格总宽度,每一列的宽度。
>>> width = 7.2
>>> colWidths = (width / len(data[0])) * inch
>>>
>>> dis_list = []
>>> for x in data:
>>>     dis_list.append(x)
配置样式,没有的就使用默认的。
>>> style = [
>>>     ('FONTSIZE', (0, 0), (-1, 0), 15),
>>>     ('BACKGROUND', (0, 0), (-1, 0), HexColor('#d5dae6')),
>>>     ('BACKGROUND', (0, 1), (-1, 1), HexColor('#d5dae6')),
>>>     ('SPAN',(0,0),(0,1)),
>>>     ('SPAN',(1,0),(2,0)),
>>>     ('SPAN',(3,0),(4,0)),
>>>     ('SPAN',(5,0),(7,0)),
>>>     ('ALIGN', (0, 0), (-1, -1), 'CENTER'),
>>>     ('VALIGN', (-1, 0), (-2, 0), 'MIDDLE'),
>>>     ('LINEBEFORE', (0, 0), (0, -1), 0.1, colors.grey),
>>>     ('TEXTCOLOR', (0, 0), (-1, 0), colors.royalblue),
>>>     ('TEXTCOLOR', (0, -1), (-1, -1), colors.red),
>>>     ('GRID', (0, 0), (-1, -1), 0.5, colors.grey),
>>> ]
>>>
>>> component_table = Table(dis_list, colWidths=colWidths,style=style)
>>> pdf = SimpleDocTemplate('./pdf_file/addtable.pdf')
4.7.3. 添加图
与在 Excel 软件内画图相似,也可以用其他的库添加。
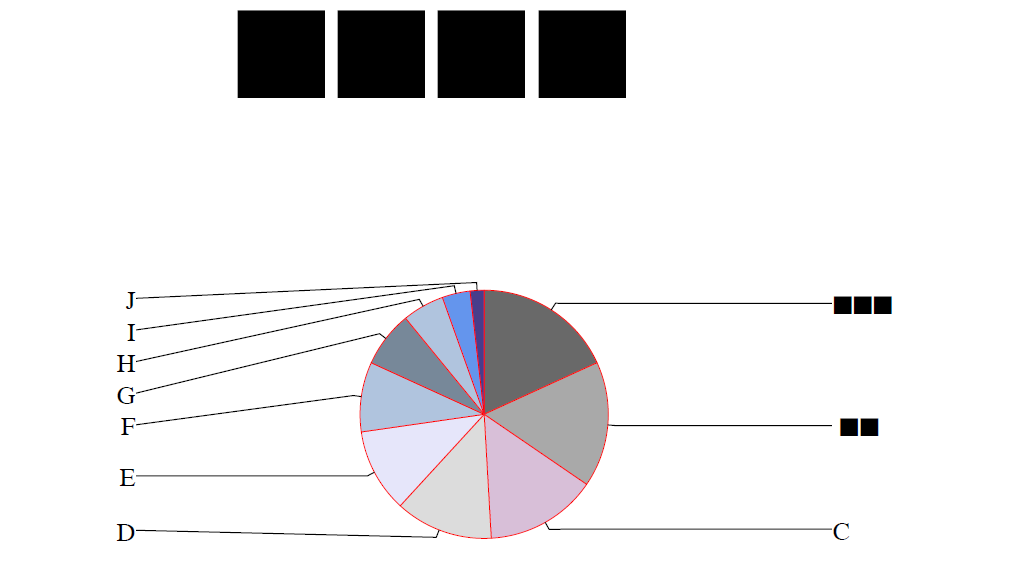
画饼状图
图形一般都需要标签进行说明,在这里我们使用中文进行显示,必须要进行注册才能使用。如果没有注册,结果如下图:
>>> from reportlab.graphics.shapes import Drawing, Rect
>>> from reportlab.graphics.charts.textlabels import Label
>>> from reportlab.graphics.charts.piecharts import Pie
>>> from reportlab.pdfbase import pdfmetrics
>>> from reportlab.pdfbase.ttfonts import TTFont
>>>
>>> pdfmetrics.registerFont(TTFont('zh','/usr/share/fonts/truetype/wqy/wqy-zenhei.ttc'))
>>> data = [10,9,8,7,6,5,4,3,2,1]
>>> labels = ['第一个','中文','C','D','E',
>>>         'F','G','H','I','J']
>>> use_colors = [HexColor("#696969"),HexColor("#A9A9A9"),HexColor("#D8BFD8"),
>>>          HexColor("#DCDCDC"),HexColor('#E6E6FA'),HexColor("#B0C4DE"),
>>>          HexColor("#778899"),HexColor('#B0C4DE'),HexColor("#6495ED"),
>>>          HexColor("#483D8B")
>>>          ]
设置图的宽度,以及图的位置,在外围添加剂一个边框。
>>> width=360
>>> pie = Pie()
>>> pie.x = 60
>>> pie.y = 20
>>> pie.slices.label_boxStrokeColor = colors.white
>>> # pie.data = data
>>> pie.labels = labels
>>> pie.simpleLabels = 0
>>> pie.sameRadii = 1
设置图形的边界颜色,空白区域的宽度,标签与内侧、外边框的距离,相当于内边距与外边距。
>>> pie.slices.strokeColor = colors.red
>>> pie.strokeWidth=1
>>> pie.strokeColor= colors.white
>>> pie.slices.label_pointer_piePad = 10
>>> pie.slices.label_pointer_edgePad = 25
>>> pie.width = width
>>> pie.direction = 'clockwise'
>>> pie.pointerLabelMode  = 'LeftRight'
程序开始时我们注册了中文,在这里设置中文显示。
>>> for i in range(len(labels)):
>>>     pie.slices[i].fontName = 'zh'
>>> for i, col in enumerate(use_colors):
>>>      pie.slices[i].fillColor  = col
标签的相关设置。
>>> width = 448
>>> height = 230
>>> d = Drawing(width,height)
>>> lab = Label()
>>> lab.x = 220
>>> lab.y = 210
>>> lab.setText('使用中文')
>>> lab.fontName = 'zh'
>>> lab.fontSize = 50
所有的都放到一个对象下面
>>> d.add(lab)
>>> d.background = Rect(0,0,width,height,strokeWidth=1,strokeColor="#868686",fillColor=None)
>>> d.add(pie)
>>>
>>> pdf=SimpleDocTemplate('./xx_addpie.pdf')
>>> pdf.multiBuild([d])
1
让我们再次查看结果。

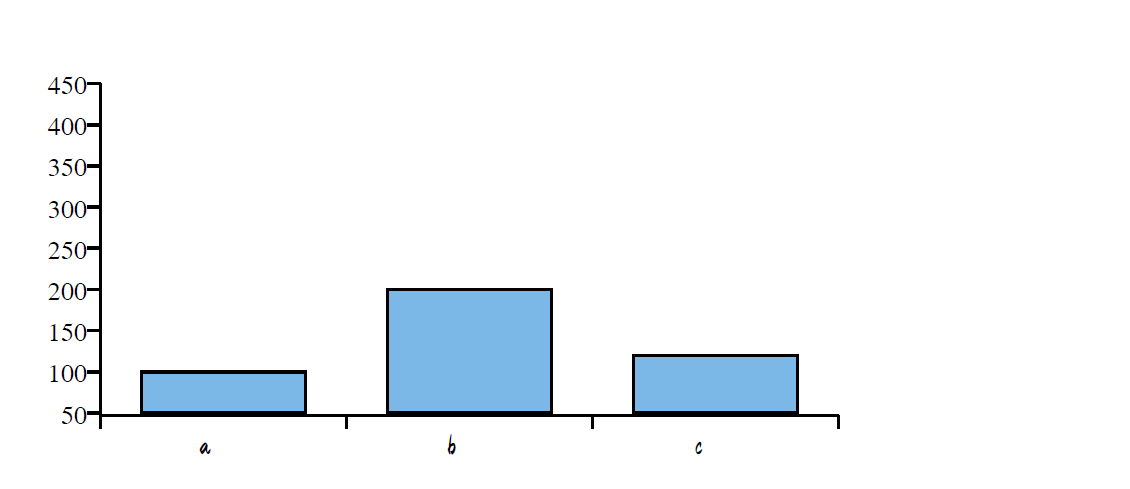
画柱状图
与画饼状图相似。
>>> min=100
>>> max=300
>>> x_list=['a', 'b', 'c']
>>> data=[(100, 200, 120)]
>>> x_label_angle=0
>>> bar_color=HexColor("#7BB8E7")
>>> height=125
>>> width=280
min:设置y轴的最小值max: 设置y轴的最大值x_list: x轴上的标签data: y轴对应标签的值x_label_angle: x轴上标签的倾斜角度bar_color: 柱的颜色 可以是含有多种颜色的列表height: 柱状图的高度width: 柱状图的宽度x和y是柱状图在框中的坐标
height柱状图的高度width柱状图的宽度bar_color若含有多种颜色在这里分配
>>> from reportlab.graphics.charts.barcharts import VerticalBarChart
>>> bc = VerticalBarChart()
>>> bc.x = 50
>>> bc.y = 50
>>> bc.height = height
>>> bc.width = width
>>> bc.data = data
>>> for j in range(len(x_list)):
>>>     setattr(bc.bars[j], 'fillColor', bar_color)
>>> minv = min * 0.5
>>> maxv = max * 1.5
>>> maxAxis = int(height/10)
>>> minStep = int((maxv-minv+maxAxis-1)/maxAxis)
minStep调整步长向上取整valueMin设置y轴的最小值valueMax设置y轴的最大值valueStep设置y轴的最小度量单位boxAnchorx轴下方标签坐标的开口方向dx,dyx和y是x轴下方的标签距离x轴远近的坐标anglex轴上描述文字的倾斜角度
>>> bc.valueAxis.valueMin = min * 0.5
>>> bc.valueAxis.valueMax = max * 1.5
>>> bc.valueAxis.valueStep = (max-min)/4
>>> if bc.valueAxis.valueStep < minStep:
>>>     bc.valueAxis.valueStep = minStep
>>> if bc.valueAxis.valueStep == 0:
>>>     bc.valueAxis.valueStep = 1
>>> bc.categoryAxis.labels.boxAnchor = 'ne'
>>> bc.categoryAxis.labels.dx = -5
>>> bc.categoryAxis.labels.dy = -5
>>> bc.categoryAxis.labels.angle = x_label_angle
>>> bc.categoryAxis.labels.fontName = 'zh'
>>> x_real_list = []
>>> if len(x_list) > 10:
>>>     for i in range(len(x_list)):
>>>         tmp = '' if i%5 != 0 else x_list[i]
>>>         x_real_list.append(tmp)
>>> else:
>>>     x_real_list = x_list
>>> bc.categoryAxis.categoryNames = x_real_list
>>> width = 448
>>> height = 230
>>> d = Drawing(width,height)
>>> lab = Label()
>>> lab.x = 220
>>> lab.y = 210
>>> lab.setText(' ')
>>> lab.fontName = 'zh'
>>> lab.fontSize = 20
>>> d.add(lab)
>>> d.background = Rect(0,0,width,height,strokeWidth=1,strokeColor="#868686",fillColor=None)
>>> d.add(bc)
>>> pdf=SimpleDocTemplate('./xx_addbar.pdf')
>>> pdf.multiBuild([d])
1
生成的结果如图所示: