>>> from env_helper import info; info()
页面更新时间: 2023-06-30 23:21:55
运行环境:
    Linux发行版本: Debian GNU/Linux 12 (bookworm)
    操作系统内核: Linux-6.1.0-9-amd64-x86_64-with-glibc2.36
    Python版本: 3.11.2
4.4. Artist对象
matplotlib API包含有三层:
backend_bases.FigureCanvas : 图表的绘制领域
backend_bases.Renderer : 知道如何在FigureCanvas上如何绘图
artist.Artist : 知道如何使用Renderer在FigureCanvas上绘图
FigureCanvas和Renderer需要处理底层的绘图操作,例如使用wxPython在界面上绘图,或者使用 PostScript绘制PDF。Artist则处理所有的高层结构,例如处理图表、文字和曲线等的绘制和布局。通 常我们只和Artist打交道,而不需要关心底层的绘制细节。 Artists分为简单类型和容器类型两种。简单类型的Artists为标准的绘图元件,例如Line2D、 Rectangle、 Text、AxesImage 等等。而容器类型则可以包含许多简单类型的Artists,使它们组织成一个整 体,例如Axis、 Axes、Figure等。
直接使用Artists创建图表的标准流程如下:
创建Figure对象
用Figure对象创建一个或者多个Axes或者Subplot对象
调用Axies等对象的方法创建各种简单类型的Artists
下面首先调用pyplot.figure辅助函数创建Figure对象,然后调用Figure对象的add_axes方法在其中创
建一个Axes对象,add_axes的参数是一个形如
[left, bottom, width, height] 的列表,
这些数值分别指定所创建的Axes对象相对于fig的位置和大小,取值范围都在0到1之间:
>>> %matplotlib inline
>>>
>>> import matplotlib.pyplot as plt
>>> plt.ioff()
>>> plt.ion()
>>>
>>> fig = plt.figure()
>>> ax = fig.add_axes([0.15, 0.1, 0.7, 0.3])
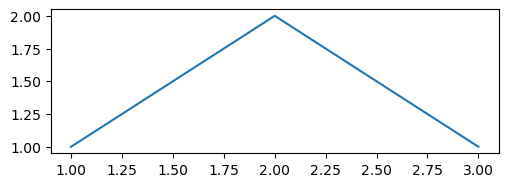
然后我们调用 ax 的 plot()
方法绘图,创建一条曲线,并且返回此曲线对象(Line2D)。
>>> fig = plt.figure()
>>> ax = fig.add_axes([0.15, 0.1, 0.7, 0.3])
>>>
>>> line, = ax.plot([1,2,3],[1,2,1])
>>> ax.lines
<Axes.ArtistList of 1 lines>

>>> fig = plt.figure()
>>> ax = fig.add_axes([0.15, 0.1, 0.7, 0.3])
>>>
>>> line, = ax.plot([1,2,3],[1,2,1])
>>> ax.lines
>>> line
<matplotlib.lines.Line2D at 0x7fe96cff7cd0>
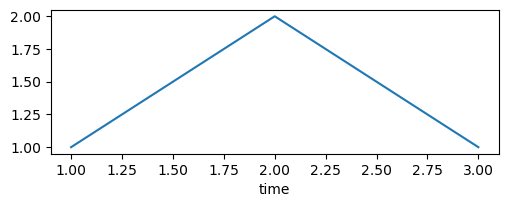
ax.lines是一个为包含ax的所有曲线的列表,后续的ax.plot调用会往此列表中添加新的曲线。如果想删除某条曲线的话,直接从此列表中删除即可。 Axes对象还包括许多其它的Artists对象,例如我们可以通过调用set_xlabel设置其X轴上的标题:
>>> fig = plt.figure()
>>> ax = fig.add_axes([0.15, 0.1, 0.7, 0.3])
>>>
>>> line, = ax.plot([1,2,3],[1,2,1])
>>> ax.set_xlabel("time")
Text(0.5, 0, 'time')
如果我们查看set_xlabel的源代码的话,会发现它是通过调用下面的语句实现的:
self.xaxis.set_label_text(xlabel) 如果我们一直跟踪下去,会发现Axes的xaxis属性是一个XAxis对象:
>>> ax.xaxis
<matplotlib.axis.XAxis at 0x7fe96ce1b510>
XAxis的label属性是一个Text对象:
>>> ax.xaxis.label
Text(0.5, 24.0, 'time')
而Text对象的_text属性为我们设置的值:
>>> ax.xaxis.label._text
'time'
这些对象都是Artists,因此也可以调用它们的属性获取函数来获得相应的属性:
>>> ax.xaxis.label.get_text()
'time'
4.4.1. Artist的属性
图表中的每个元素都用一个matplotlib的Artist对象表示,而每个Artist对象都有一大堆属性控制其显 示效果。例如Figure对象和Axes对象都有patch属性作为其背景,它的值是一个Rectangle对象。通过 设置此它的一些属性可以修改Figrue图表的背景颜色或者透明度等属性,下面的例子将图表的背景颜 色设置为绿色:
>>> import matplotlib.pyplot as plt
>>> fig = plt.figure()
>>> ax = fig.add_axes([0.15, 0.1, 0.7, 0.3])
>>> fig.show()

>>> fig.patch.set_color("g")
>>> fig.canvas.draw()
>>> fig.show()
>>> plt.draw()
<Figure size 640x480 with 0 Axes>
patch的color属性通过set_color函数进行设置,属性修改之后并不会立即反映到图表的显示上,还需 要调用fig.canvas.draw()函数才能够更新显示。 下面是Artist对象都具有的一些属性:
alpha : 透明度,值在0到1之间,0为完全透明,1为完全不透明
animated : 布尔值,在绘制动画效果时使用
axes : 此Artist对象所在的Axes对象,可能为None
clip_box : 对象的裁剪框
clip_on : 是否裁剪
clip_path : 裁剪的路径
contains : 判断指定点是否在对象上的函数
figure : 所在的Figure对象,可能为None
label : 文本标签
picker : 控制Artist对象选取
transform : 控制偏移旋转
visible : 是否可见
zorder : 控制绘图顺序
Artist对象的所有属性都通过相应的 get_* 和 set_* 函数进行读写,例如下面的语句将alpha属性设置 为当前值的一半:
fig.set_alpha(0.5*fig.get_alpha())
如果你想用一条语句设置多个属性的话,可以使用set函数:
>>> fig.set(alpha=0.5, zorder=2)
[None, None]
使用前面介绍的 matplotlib.pyplot.getp 函数可以方便地输出Artist对象的所有属性名和值。
>>> plt.getp(fig.patch)
agg_filter = None
alpha = None
angle = 0.0
animated = False
antialiased or aa = False
bbox = Bbox(x0=0.0, y0=0.0, x1=1.0, y1=1.0)
capstyle = butt
center = [0.5 0.5]
children = []
clip_box = None
clip_on = True
clip_path = None
corners = [[0. 0.]  [1. 0.]  [1. 1.]  [0. 1.]]
data_transform = BboxTransformTo(     TransformedBbox(         Bbox...
edgecolor or ec = (0.0, 0.5, 0.0, 1)
extents = Bbox(x0=0.0, y0=0.0, x1=640.0, y1=480.0)
facecolor or fc = (0.0, 0.5, 0.0, 1)
figure = Figure(640x480)
fill = True
gid = None
hatch = None
height = 1
in_layout = False
joinstyle = miter
label =
linestyle or ls = solid
linewidth or lw = 0.0
mouseover = False
patch_transform = CompositeGenericTransform(     BboxTransformTo(   ...
path = Path(array([[0., 0.],        [1., 0.],        [1.,...
path_effects = []
picker = None
rasterized = False
sketch_params = None
snap = None
tightbbox = Bbox(x0=0.0, y0=0.0, x1=640.0, y1=480.0)
transform = CompositeGenericTransform(     CompositeGenericTra...
transformed_clip_path_and_affine = (None, None)
url = None
verts = [[  0.   0.]  [640.   0.]  [640. 480.]  [  0. 480....
visible = True
width = 1
window_extent = Bbox(x0=0.0, y0=0.0, x1=640.0, y1=480.0)
x = 0
xy = (0, 0)
y = 0
zorder = 1
4.4.2. Figure容器
现在我们知道如何观察和修改已知的某个Artist对象的属性,接下来要解决如何找到指定的Artist对 象。前面我们介绍过Artist对象有容器类型和简单类型两种,这一节让我们来详细看看容器类型的内 容。 最大的Artist容器是matplotlib.figure.Figure,它包括组成图表的所有元素。图表的背景是一个Rectangle对象,用Figure.patch属性表示。当你通过调用add_subplot或者add_axes方法往图表中添加轴 (子图时),这些子图都将添加到Figure.axes属性中,同时这两个方法也返回添加进axes属性的对象, 注意返回值的类型有所不同,实际上AxesSubplot是Axes的子类。
>>> fig = plt.figure()
>>> ax1 = fig.add_subplot(211)
>>> ax2 = fig.add_axes([0.1, 0.1, 0.7, 0.3])
>>> ax1
<AxesSubplot: >
>>> ax2
<Axes: >
>>> fig.axes
[<AxesSubplot: >, <Axes: >]
为了支持pylab中的gca ()等函数,Figure对象内部保存有当前轴的信息,因此不建议直接对Figure.axes属性进行列表操作,而应该使用add_subplot, add_axes, delaxes等方法进行添加和删除操作。但是使用for循环对axes中的每个元素进行操作是没有问题的,下面的语句打开所有子图的栅格。
>>> for ax in fig.axes: ax.grid(True)
Figure对象可以拥有自己的文字、线条以及图像等简单类型的Artist。缺省的坐标系统为像素点,但是 可以通过设置Artist对象的transform属性修改坐标系的转换方式。最常用的Figure对象的坐标系是以 左下角为坐标原点(0,0),右上角为坐标(1,1)。下面的程序创建并添加两条直线到fig中:
>>> from matplotlib.lines import Line2D
>>> fig = plt.figure()
>>> line1 = Line2D([0,1],[0,1], transform=fig.transFigure, figure=fig, color="r")
>>> line2 = Line2D([0,1],[1,0], transform=fig.transFigure, figure=fig, color="g")
>>> fig.lines.extend([line1, line2])
>>> fig.show()
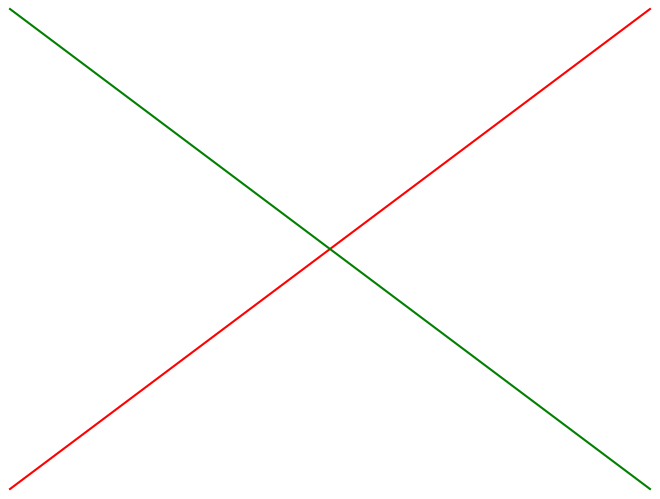
图 5.4 - 在Figure对象中手工绘制直线 注意为了让所创建的Line2D对象使用fig的坐标,我们将fig.TransFigure赋给Line2D对象的transform 属性;为了让Line2D对象知道它是在fig对象中,我们还设置其figure属性为fig;最后还需要将创建的 两个Line2D对象添加到fig.lines属性中去。 Figure对象有如下属性包含其它的Artist对象:
axes : Axes对象列表
patch : 作为背景的Rectangle对象
images : FigureImage对象列表,用来显示图片
legends : Legend对象列表
lines : Line2D对象列表
patches : patch对象列表
texts : Text对象列表,用来显示文字
4.4.3. Axes容器
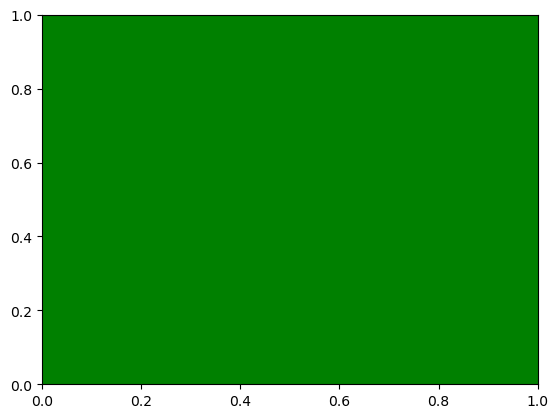
Axes容器是整个matplotlib库的核心,它包含了组成图表的众多Artist对象,并且有许多方法函数帮 助我们创建、修改这些对象。和Figure一样,它有一个patch属性作为背景,当它是笛卡尔坐标时, patch属性是一个Rectangle对象,而当它是极坐标时,patch属性则是Circle对象。例如下面的语句设 置Axes对象的背景颜色为绿色:
>>> fig = plt.figure()
>>> ax = fig.add_subplot(111)
>>> ax.patch.set_facecolor("green")
当你调用Axes的绘图方法(例如plot),它将创建一组Line2D对象,并将所有的关键字参数传递给这 些Line2D对象,并将它们添加进Axes.lines属性中,最后返回所创建的Line2D对象列表:
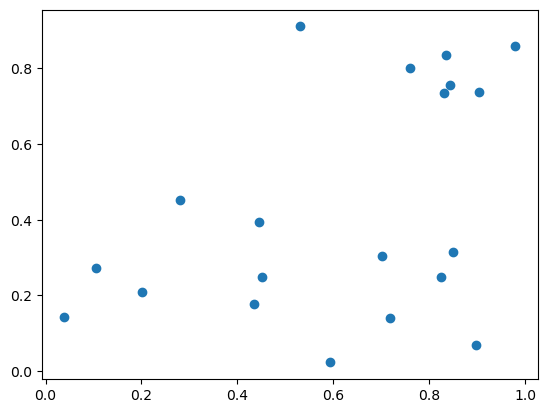
>>> import numpy as np
>>> x, y = np.random.rand(2, 100)
>>> line, = ax.plot(x, y, "-", color="blue", linewidth=2)
>>> line
<matplotlib.lines.Line2D at 0x7fe96cf27cd0>
>>> ax.lines
<Axes.ArtistList of 1 lines>
注意plot返回的是一个Line2D对象的列表,因为我们可以传递多组X,Y轴的数据,一次绘制多条曲线。 与plot方法类似,绘制直方图的方法bar和绘制柱状统计图的方法hist将创建一个Patch对象的列表, 每个元素实际上都是Patch的子类Rectangle,并且将所创建的Patch对象都添加进Axes.patches属性 中:
>>> ax = fig.add_subplot(111)
>>> n, bins, rects = ax.hist(np.random.randn(1000), 50, facecolor="blue")
>>> rects
<BarContainer object of 50 artists>
>>> rects[0]
<matplotlib.patches.Rectangle at 0x7fe96cc38dd0>
>>> ax.patches[0]
<matplotlib.patches.Rectangle at 0x7fe96cc38dd0>
一般我们不会直接对Axes.lines或者Axes.patches属性进行操作,而是调用add_line或者add_patch等 方法,这些方法帮助我们完成许多属性设置工作:
>>> import matplotlib
>>> fig = plt.figure()
>>> ax = fig.add_subplot(111)
>>> rect = matplotlib.patches.Rectangle((1,1), width=5, height=12)
>>> # print(rect.get_axes()) # rect的axes属性为空

>>> rect.get_transform() # rect的transform属性为缺省值
<matplotlib.transforms.CompositeGenericTransform at 0x7fe96cb40710>
>>> ax.add_patch(rect) # 将rect添加进ax
<matplotlib.patches.Rectangle at 0x7fe96cd045d0>
>>> # rect.get_axes() # 于是rect的axes属性就是ax
>>>  # rect的transform属性和ax的transData相同
>>> rect.get_transform()
<matplotlib.transforms.CompositeGenericTransform at 0x7fe96cb9be50>
>>> ax.transData
<matplotlib.transforms.CompositeGenericTransform at 0x7fe96cb33650>
>>> ax.get_xlim() # ax的X轴范围为0到1,无法显示完整的rect
(0.0, 1.0)
>>> # ax.dataLim._get_bounds() # 数据的范围和rect的大小一致
>>> ax.autoscale_view() # 自动调整坐标轴范围
>>> ax.get_xlim() # 于是X轴可以完整显示rect
(0.75, 6.25)
>>> plt.show()
通过上面的例子我们可以看出,add_patch方法帮助我们设置了rect的axes和transform属性。 下面详细列出Axes包含各种Artist对象的属性:
artists : Artist对象列表
patch : 作为Axes背景的Patch对象,可以是Rectangle或者Circle
collections : Collection对象列表
images : AxesImage对象列表
legends : Legend对象列表
lines : Line2D对象列表
patches : Patch对象列表
texts : Text对象列表
xaxis : XAxis对象
yaxis : YAxis对象
下面列出Axes的创建Artist对象的方法:
Axes的方法 所创建的对象 添加进的列表
annotate Annotate texts
bars Rectangle patches
errorbar Line2D, Rectangle lines,patches
fill Polygon patches
hist Rectangle patches
imshow AxesImage images
legend Legend legends
plot Line2D lines
scatter PolygonCollection Collections
text Text texts
下面以绘制散列图(scatter)为例,验证一下:
>>> fig = plt.figure()
>>> ax = fig.add_subplot(111)
>>> t = ax.scatter(np.random.rand(20), np.random.rand(20))
>>> t # 返回值为CircleCollection对象
<matplotlib.collections.PathCollection at 0x7fe96ccd0c50>
>>> ax.collections # 返回的对象已经添加进了collections列表中
<Axes.ArtistList of 1 collections>
>>> fig.show()
>>> t.get_sizes() # 获得Collection的点数
array([36.])
图 5.5 - 用scatter函数绘制散列图
4.4.4. Axis容器
Axis容器包括坐标轴上的刻度线、刻度文本、坐标网格以及坐标轴标题等内容。刻度包括主刻度和 副刻度,分别通过Axis.get_major_ticks和Axis.get_minor_ticks方法获得。每个刻度线都是一个XTick 或者YTick对象,它包括实际的刻度线和刻度文本。为了方便访问刻度线和文本,Axis对象提供了 get_ticklabels和get_ticklines方法分别直接获得刻度线和刻度文本:
>>> import numpy as np
>>> import matplotlib.pyplot as plt
>>> plt.plot([1,2,3],[4,5,6])
[<matplotlib.lines.Line2D at 0x7fe96cb85690>]
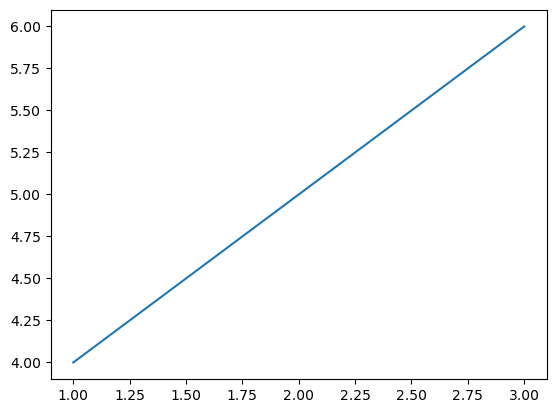
>>> plt.show()
>>> axis = plt.gca().xaxis
>>> axis.get_ticklocs() # 获得刻度的位置列表
array([0. , 0.2, 0.4, 0.6, 0.8, 1. ])
>>> axis.get_ticklabels() # 获得刻度标签列表
[Text(0.0, 0, '0.0'),
 Text(0.2, 0, '0.2'),
 Text(0.4, 0, '0.4'),
 Text(0.6000000000000001, 0, '0.6'),
 Text(0.8, 0, '0.8'),
 Text(1.0, 0, '1.0')]
>>> [x.get_text() for x in axis.get_ticklabels()] # 获得刻度的文本字符串
['0.0', '0.2', '0.4', '0.6', '0.8', '1.0']
>>> axis.get_ticklines() # 获得主刻度线列表,图的上下刻度线共10条
<a list of 12 Line2D ticklines objects>
>>> axis.get_ticklines(minor=True) # 获得副刻度线列表
<a list of 0 Line2D ticklines objects>
获得刻度线或者刻度标签之后,可以设置其各种属性,下面设置刻度线为绿色粗线,文本为红色并且 旋转45度:
>>> for label in axis.get_ticklabels():
>>>     label.set_color("red")
>>>     label.set_rotation(45)
>>>     label.set_fontsize(16)
>>> for line in axis.get_ticklines():
>>>     line.set_color("green")
>>>     line.set_markersize(25)
>>>     line.set_markeredgewidth(3)
>>> plt.show()
手工配置X轴的刻度线和刻度文本的样式
上面的例子中,获得的副刻度线列表为空,这是因为用于计算副刻度的对象缺省为NullLocator,它不 产生任何刻度线;而计算主刻度的对象为AutoLocator,它会根据当前的缩放等配置自动计算刻度的 位置:
>>> axis.get_minor_locator() # 计算副刻度的对象
<matplotlib.ticker.NullLocator at 0x7fe96cc01d90>
>>> axis.get_major_locator() # 计算主刻度的对象
<matplotlib.ticker.AutoLocator at 0x7fe96cf35c90>
我们可以使用程序为Axis对象设置不同的Locator对象,用来手工设置刻度的位置;设置Formatter对 象用来控制刻度文本的显示。下面的程序设置X轴的主刻度为pi/4,副刻度为pi/20,并且主刻度上的 文本以pi为单位:
>>> # -*- coding: utf-8 -*-
>>> import matplotlib.pyplot as pl
>>> from matplotlib.ticker import MultipleLocator, FuncFormatter
>>> import numpy as np
>>> x = np.arange(0, 4*np.pi, 0.01)
>>> y = np.sin(x)
>>> pl.figure(figsize=(8,4))
>>> pl.plot(x, y)
>>> ax = pl.gca()
>>>
>>> def pi_formatter(x, pos):
>>>
>>>     m = np.round(x / (np.pi/4))
>>>     n = 4
>>>     if m%2==0: m, n = m/2, n/2
>>>     if m%2==0: m, n = m/2, n/2
>>>     if m == 0:
>>>         return "0"
>>>     if m == 1 and n == 1:
>>>         return "$\pi$"
>>>     if n == 1:
>>>         return r"$%d \pi$" % m
>>>     if m == 1:
>>>         return r"$\frac{\pi}{%d}$" % n
>>>     return r"$\frac{%d \pi}{%d}$" % (m,n)
>>> # 设置两个坐标轴的范围
>>> pl.ylim(-1.5,1.5)
>>> pl.xlim(0, np.max(x))
>>> # 设置图的底边距
>>> pl.subplots_adjust(bottom = 0.15)
>>> pl.grid() #开启网格
>>> # 主刻度为pi/4
>>> ax.xaxis.set_major_locator( MultipleLocator(np.pi/4) )
>>> # 主刻度文本用pi_formatter函数计算
>>> ax.xaxis.set_major_formatter( FuncFormatter( pi_formatter ) )
>>> # 副刻度为pi/20
>>>
>>> ax.xaxis.set_minor_locator( MultipleLocator(np.pi/20) )
>>> # 设置刻度文本的大小
>>> for tick in ax.xaxis.get_major_ticks():
>>>     tick.label1.set_fontsize(16)
>>> pl.show()
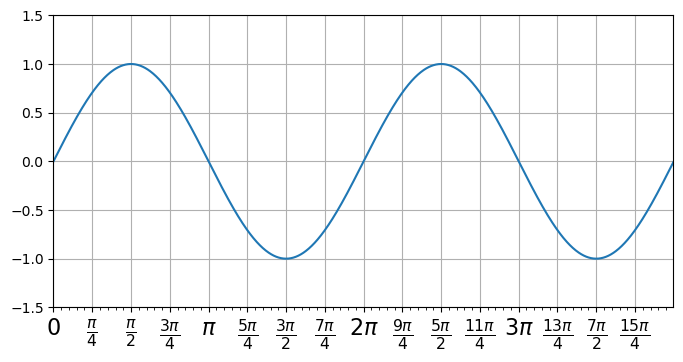
关于刻度的定位和文本格式的东西都在matplotlib.ticker中定义,程序中使用到如下两个类:
MultipleLocator : 以指定值的整数倍为刻度放置刻度线
FuncFormatter :
使用指定的函数计算刻度文本,他会传递给所指定的函数两个参数:刻度值和刻度序号,程序中通过比较笨的办法计算出刻度值所对应的刻度文本
此外还有很多预定义的Locator和Formatter类,详细内容请参考相应的API文档。