>>> from env_helper import info; info()
页面更新时间: 2023-06-24 12:08:33
运行环境:
    Linux发行版本: Debian GNU/Linux 12 (bookworm)
    操作系统内核: Linux-6.1.0-9-amd64-x86_64-with-glibc2.36
    Python版本: 3.11.2
2.5. python数字图像处理(12):基本图形的绘制
图形包括线条、圆形、椭圆形、多边形等。
在skimage包中,绘制图形用的是draw模块,不要和绘制图像搞混了。
2.5.1. 画线条
函数调用格式为:
skimage.draw.line(r1,c1,r2,c2)
r1,r2: 开始点的行数和结束点的行数
c1,c2: 开始点的列数和结束点的列数
返回当前绘制图形上所有点的坐标,如:
rr, cc =draw.line(1, 5, 8, 2)
表示从(1,5)到(8,2)连一条线,返回线上所有的像素点坐标[rr,cc]
>>> from skimage import draw,data
>>> from skimage import io
>>> from copy import deepcopy
>>>
>>> import matplotlib.pyplot as plt
>>>
>>> # img=data.chelsea()
>>>
>>>
>>> img0=io.imread('./img_mxb.jpg')
>>>
>>> img = deepcopy(img0)
>>>
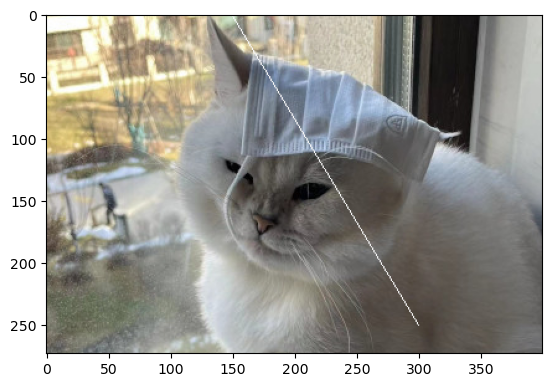
>>> rr, cc =draw.line(1, 150, 250, 300)
>>> img[rr, cc] =250
>>> plt.imshow(img,plt.cm.gray)
<matplotlib.image.AxesImage at 0x7f3e0be30090>
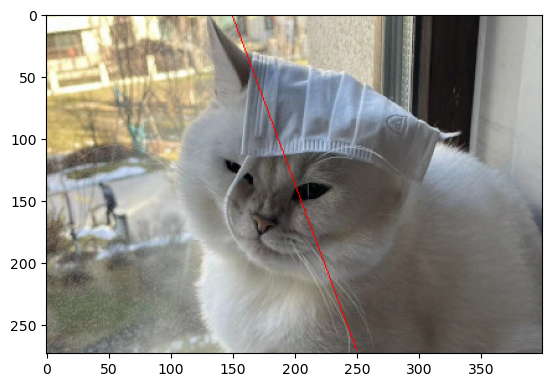
如果想画其它颜色的线条,则可以使用set_color()函数,格式为:
skimage.draw.set_color(img, coords, color)
例:
draw.set_color(img,[rr,cc],[255,0,0])
则绘制红色线条。
>>> # import matplotlib.pyplot as plt
>>> # img=data.chelsea()
>>> img = deepcopy(img0)
>>> rr, cc =draw.line(1, 150, 270, 250)
>>> draw.set_color(img,[rr,cc],[255,0,0])
>>> plt.imshow(img,plt.cm.gray)
<matplotlib.image.AxesImage at 0x7f3e0be72e90>
2.5.2. 多边形
函数格式:skimage.draw.polygon(Y,X)
Y为多边形顶点的行集合,X为各顶点的列值集合。
>>> # import matplotlib.pyplot as plt
>>> # import numpy as np
>>> # img=data.chelsea()
>>>
>>> img = deepcopy(img0)
>>> Y=np.array([10,10,60,60])
>>> X=np.array([200,400,400,200])
>>> rr, cc=draw.polygon(Y,X)
>>> draw.set_color(img,[rr,cc],[255,0,0])
>>> plt.imshow(img,plt.cm.gray)
<matplotlib.image.AxesImage at 0x7f3e0bd29ed0>
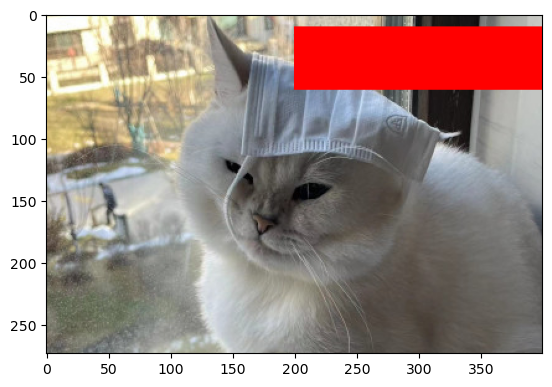
我在此处只设置了四个顶点,因此是个四边形。
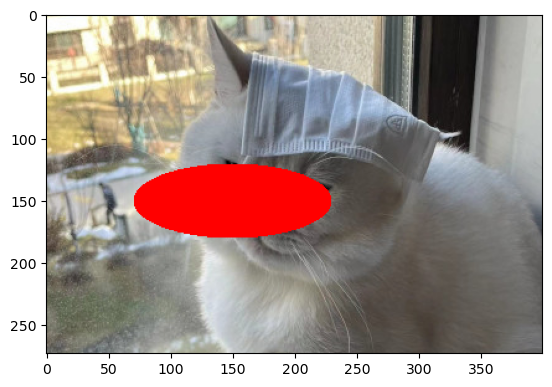
2.5.3. 椭圆
格式:skimage.draw.ellipse(cy, cx, yradius, xradius)
cy和cx为中心点坐标,yradius和xradius代表长短轴。
>>> # import matplotlib.pyplot as plt
>>> # img=data.chelsea()
>>>
>>> img = deepcopy(img0)
>>> rr, cc=draw.ellipse(150, 150, 30, 80)
>>> draw.set_color(img,[rr,cc],[255,0,0])
>>> plt.imshow(img,plt.cm.gray)
<matplotlib.image.AxesImage at 0x7f3e0bd4af90>
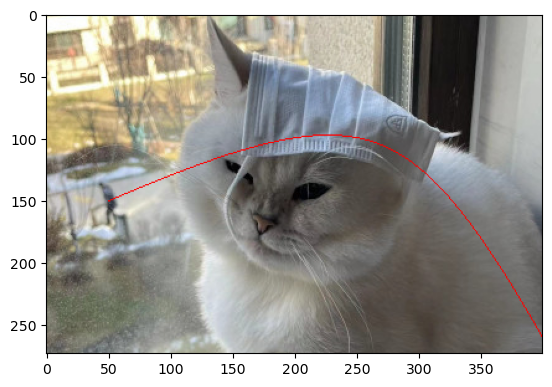
2.5.4. 贝塞儿曲线
格式:skimage.draw.bezier_curve(y1,x1,y2,x2,y3,x3,weight)
y1,x1表示第一个控制点坐标
y2,x2表示第二个控制点坐标
y3,x3表示第三个控制点坐标
weight表示中间控制点的权重,用于控制曲线的弯曲度。
>>> # import matplotlib.pyplot as plt
>>> # img=data.chelsea()
>>>
>>> img = deepcopy(img0)
>>> rr, cc=draw.bezier_curve(150,50,50,280,260,400,2)
>>> draw.set_color(img,[rr,cc],[255,0,0])
>>> plt.imshow(img,plt.cm.gray)
<matplotlib.image.AxesImage at 0x7f3e0bd78110>
2.5.5. 画空心圆
和前面的画圆是一样的,只是前面是实心圆,而此处画空心圆,只有边框线。
格式:skimage.draw.circle_perimeter(yx,yc,radius)
yx,yc是圆心坐标,radius是半径
>>> # import matplotlib.pyplot as plt
>>> # img=data.chelsea()
>>> img = deepcopy(img0)
>>> rr, cc=draw.circle_perimeter(150,150,50)
>>> draw.set_color(img,[rr,cc],[255,0,0])
>>> plt.imshow(img,plt.cm.gray)
<matplotlib.image.AxesImage at 0x7f3e0bc42e90>

2.5.6. 空心椭圆
格式:skimage.draw.ellipse_perimeter(cy, cx, yradius, xradius)
cy,cx表示圆心
yradius,xradius表示长短轴
>>> # import matplotlib.pyplot as plt
>>> # img=data.chelsea()
>>> img = deepcopy(img0)
>>> rr, cc=draw.ellipse_perimeter(150, 150, 30, 80)
>>> draw.set_color(img,[rr,cc],[255,0,0])
>>> plt.imshow(img,plt.cm.gray)
<matplotlib.image.AxesImage at 0x7f3e0bde9e90>

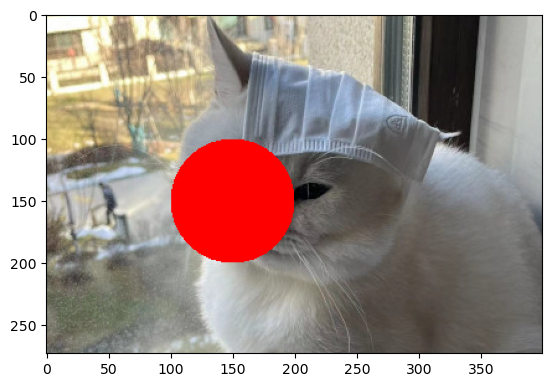
2.5.7. 画圆
报错:AttributeError: module ‘skimage.draw’ has no attribute ‘circle’ 。
原来scikit-image
0.15.0的draw.py文件里还有circle函数,现在当前使用的scikit-image
0.19.3已经删除了circle函数。 circle函数的本质是椭圆函数。所以使用
ellipse 来替代。
>>> # import matplotlib.pyplot as plt
>>> # img=data.chelsea()
>>> # rr, cc=draw.circle(150,150,50)
>>> img = deepcopy(img0)
>>> rr, cc = draw.ellipse(150, 150, 50,50)
>>> draw.set_color(img,[rr,cc],[255,0,0])
>>> plt.imshow(img,plt.cm.gray)
<matplotlib.image.AxesImage at 0x7f3e0bff6350>