3.3. python数字图像处理(16):霍夫圆和椭圆变换
在极坐标中,圆的表示方式为:
x=x0+rcosθ
y=y0+rsinθ
圆心为(x0,y0),r为半径,θ为旋转度数,值范围为0-359
如果给定圆心点和半径,则其它点是否在圆上,我们就能检测出来了。在图像中,我们将每个非0像素点作为圆心点,以一定的半径进行检测,如果有一个点在圆上,我们就对这个圆心累加一次。如果检测到一个圆,那么这个圆心点就累加到最大,成为峰值。因此,在检测结果中,一个峰值点,就对应一个圆心点。
霍夫圆检测的函数:
skimage.transform.hough_circle(image, radius)
radius是一个数组,表示半径的集合,如[3,4,5,6]
返回一个3维的数组(radius index, M, N), 第一维表示半径的索引,后面两维表示图像的尺寸。
3.3.1. 例1:绘制两个圆形,用霍夫圆变换将它们检测出来。
>>> %matplotlib inline
>>>
>>> import numpy as np
>>> import matplotlib.pyplot as plt
>>> from skimage import draw,transform,feature
>>>
>>> img = np.zeros((250, 250,3), dtype=np.uint8)
>>> rr, cc = draw.circle_perimeter(60, 60, 50)  #以半径50画一个圆
>>> rr1, cc1 = draw.circle_perimeter(150, 150, 60) #以半径60画一个圆
>>> img[cc, rr,:] =255
>>> img[cc1, rr1,:] =255
>>>
>>> fig, (ax0,ax1) = plt.subplots(1,2, figsize=(8, 5))
>>>
>>> ax0.imshow(img)  #显示原图
>>> ax0.set_title('origin image')
>>>
>>> hough_radii = np.arange(50, 80, 5)  #半径范围
>>> hough_res =transform.hough_circle(img[:,:,0], hough_radii)  #圆变换
>>>
>>> centers = []  #保存所有圆心点坐标
>>> accums = []   #累积值
>>> radii = []    #半径
>>>
>>> for radius, h in zip(hough_radii, hough_res):
>>>     #每一个半径值,取出其中两个圆
>>>     num_peaks = 2
>>>     peaks =feature.peak_local_max(h, num_peaks=num_peaks) #取出峰值
>>>     centers.extend(peaks)
>>>     accums.extend(h[peaks[:, 0], peaks[:, 1]])
>>>     radii.extend([radius] * num_peaks)
>>>
>>> #画出最接近的圆
>>> image =np.copy(img)
>>> for idx in np.argsort(accums)[::-1][:2]:
>>>     center_x, center_y = centers[idx]
>>>     radius = radii[idx]
>>>     cx, cy =draw.circle_perimeter(center_y, center_x, radius)
>>>     image[cy, cx] =(255,0,0)
>>>
>>> ax1.imshow(image)
>>> ax1.set_title('detected image')
Text(0.5, 1.0, 'detected image')
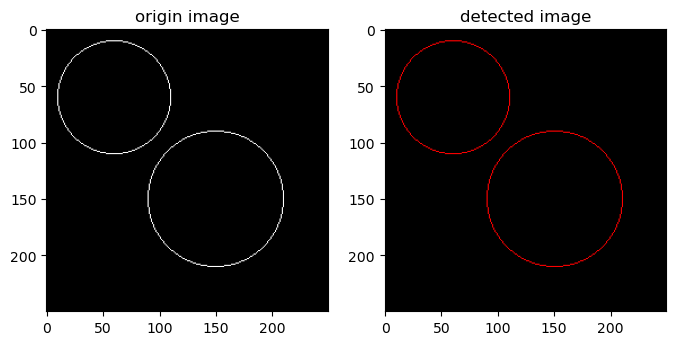
结果图如上:原图中的圆用白色绘制,检测出的圆用红色绘制。
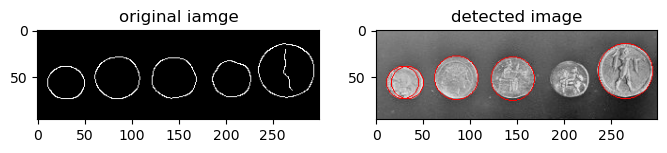
3.3.2. 例2,检测出下图中存在的硬币。
>>> import numpy as np
>>> import matplotlib.pyplot as plt
>>> from skimage import data, color,draw,transform,feature,util
>>>
>>> image = util.img_as_ubyte(data.coins()[0:95, 70:370]) #裁剪原图片
>>> edges =feature.canny(image, sigma=3, low_threshold=10, high_threshold=50) #检测canny边缘
>>>
>>> fig, (ax0,ax1) = plt.subplots(1,2, figsize=(8, 5))
>>>
>>> ax0.imshow(edges, cmap=plt.cm.gray)  #显示canny边缘
>>> ax0.set_title('original iamge')
>>>
>>> hough_radii = np.arange(15, 30, 2)  #半径范围
>>> hough_res =transform.hough_circle(edges, hough_radii)  #圆变换
>>>
>>> centers = []  #保存中心点坐标
>>> accums = []   #累积值
>>> radii = []    #半径
>>>
>>> for radius, h in zip(hough_radii, hough_res):
>>>     #每一个半径值,取出其中两个圆
>>>     num_peaks = 2
>>>     peaks =feature.peak_local_max(h, num_peaks=num_peaks) #取出峰值
>>>     centers.extend(peaks)
>>>     accums.extend(h[peaks[:, 0], peaks[:, 1]])
>>>     radii.extend([radius] * num_peaks)
>>>
>>> #画出最接近的5个圆
>>> image = color.gray2rgb(image)
>>> for idx in np.argsort(accums)[::-1][:5]:
>>>     center_x, center_y = centers[idx]
>>>     radius = radii[idx]
>>>     cx, cy =draw.circle_perimeter(center_y, center_x, radius)
>>>     image[cy, cx] = (255,0,0)
>>>
>>> ax1.imshow(image)
>>> ax1.set_title('detected image')
Text(0.5, 1.0, 'detected image')
椭圆变换是类似的,使用函数为:
skimage.transform.hough_ellipse(img,accuracy, threshold, min_size, max_size)
输入参数:
img: 待检测图像。accuracy: 使用在累加器上的短轴二进制尺寸,是一个double型的值,默认为1thresh: 累加器阈值,默认为4min_size: 长轴最小长度,默认为4max_size: 短轴最大长度,默认为None,表示图片最短边的一半。
返回一个 [(accumulator, y0, x0, a, b, orientation)] 数组,
accumulator 表示累加器, (y0,x0) 表示椭圆中心点, (a,b)
分别表示长短轴, orientation 表示椭圆方向。
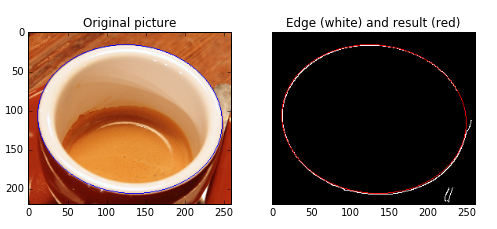
3.3.3. 例:检测出咖啡图片中的椭圆杯口
>>> import matplotlib.pyplot as plt
>>> from skimage import data,draw,color,transform,feature
>>>
>>> #加载图片,转换成灰度图并检测边缘
>>> image_rgb = data.coffee()[0:220, 160:420] #裁剪原图像,不然速度非常慢
>>> image_gray = color.rgb2gray(image_rgb)
>>> edges = feature.canny(image_gray, sigma=2.0, low_threshold=0.55, high_threshold=0.8)
>>> #执行椭圆变换
>>> result =transform.hough_ellipse(edges, accuracy=20, threshold=250,min_size=100, max_size=120)
>>> result.sort(order='accumulator') #根据累加器排序
>>> #估计椭圆参数
>>> best = list(result[-1])  #排完序后取最后一个
>>> yc, xc, a, b = [int(round(x)) for x in best[1:5]]
>>> orientation = best[5]
>>> #在原图上画出椭圆
>>> cy, cx =draw.ellipse_perimeter(yc, xc, a, b, orientation)
>>> image_rgb[cy, cx] = (0, 0, 255) #在原图中用蓝色表示检测出的椭圆
>>> #分别用白色表示canny边缘,用红色表示检测出的椭圆,进行对比
>>> edges = color.gray2rgb(edges)
>>> edges[cy, cx] = (250, 0, 0)
>>> fig2, (ax1, ax2) = plt.subplots(ncols=2, nrows=1, figsize=(8, 4))
>>> ax1.set_title('Original picture')
>>> ax1.imshow(image_rgb)
>>>
>>> ax2.set_title('Edge (white) and result (red)')
>>> ax2.imshow(edges)
>>>
>>> plt.show()
---------------------------------------------------------------------------

ValueError                                Traceback (most recent call last)

File /usr/lib/python3/dist-packages/IPython/core/formatters.py:339, in BaseFormatter.__call__(self, obj)
    337     pass
    338 else:
--> 339     return printer(obj)
    340 # Finally look for special method names
    341 method = get_real_method(obj, self.print_method)


File /usr/lib/python3/dist-packages/IPython/core/pylabtools.py:151, in print_figure(fig, fmt, bbox_inches, base64, **kwargs)
    148     from matplotlib.backend_bases import FigureCanvasBase
    149     FigureCanvasBase(fig)
--> 151 fig.canvas.print_figure(bytes_io, **kw)
    152 data = bytes_io.getvalue()
    153 if fmt == 'svg':


File /usr/lib/python3/dist-packages/matplotlib/backend_bases.py:2314, in FigureCanvasBase.print_figure(self, filename, dpi, facecolor, edgecolor, orientation, format, bbox_inches, pad_inches, bbox_extra_artists, backend, **kwargs)
   2308     renderer = _get_renderer(
   2309         self.figure,
   2310         functools.partial(
   2311             print_method, orientation=orientation)
   2312     )
   2313     with getattr(renderer, "_draw_disabled", nullcontext)():
-> 2314         self.figure.draw(renderer)
   2316 if bbox_inches:
   2317     if bbox_inches == "tight":


File /usr/lib/python3/dist-packages/matplotlib/artist.py:74, in _finalize_rasterization.<locals>.draw_wrapper(artist, renderer, *args, **kwargs)
     72 @wraps(draw)
     73 def draw_wrapper(artist, renderer, *args, **kwargs):
---> 74     result = draw(artist, renderer, *args, **kwargs)
     75     if renderer._rasterizing:
     76         renderer.stop_rasterizing()


File /usr/lib/python3/dist-packages/matplotlib/artist.py:51, in allow_rasterization.<locals>.draw_wrapper(artist, renderer)
     48     if artist.get_agg_filter() is not None:
     49         renderer.start_filter()
---> 51     return draw(artist, renderer)
     52 finally:
     53     if artist.get_agg_filter() is not None:


File /usr/lib/python3/dist-packages/matplotlib/figure.py:3082, in Figure.draw(self, renderer)
   3079         # ValueError can occur when resizing a window.
   3081 self.patch.draw(renderer)
-> 3082 mimage._draw_list_compositing_images(
   3083     renderer, self, artists, self.suppressComposite)
   3085 for sfig in self.subfigs:
   3086     sfig.draw(renderer)


File /usr/lib/python3/dist-packages/matplotlib/image.py:131, in _draw_list_compositing_images(renderer, parent, artists, suppress_composite)
    129 if not_composite or not has_images:
    130     for a in artists:
--> 131         a.draw(renderer)
    132 else:
    133     # Composite any adjacent images together
    134     image_group = []


File /usr/lib/python3/dist-packages/matplotlib/artist.py:51, in allow_rasterization.<locals>.draw_wrapper(artist, renderer)
     48     if artist.get_agg_filter() is not None:
     49         renderer.start_filter()
---> 51     return draw(artist, renderer)
     52 finally:
     53     if artist.get_agg_filter() is not None:


File /usr/lib/python3/dist-packages/matplotlib/axes/_base.py:3100, in _AxesBase.draw(self, renderer)
   3097         a.draw(renderer)
   3098     renderer.stop_rasterizing()
-> 3100 mimage._draw_list_compositing_images(
   3101     renderer, self, artists, self.figure.suppressComposite)
   3103 renderer.close_group('axes')
   3104 self.stale = False


File /usr/lib/python3/dist-packages/matplotlib/image.py:131, in _draw_list_compositing_images(renderer, parent, artists, suppress_composite)
    129 if not_composite or not has_images:
    130     for a in artists:
--> 131         a.draw(renderer)
    132 else:
    133     # Composite any adjacent images together
    134     image_group = []


File /usr/lib/python3/dist-packages/matplotlib/artist.py:51, in allow_rasterization.<locals>.draw_wrapper(artist, renderer)
     48     if artist.get_agg_filter() is not None:
     49         renderer.start_filter()
---> 51     return draw(artist, renderer)
     52 finally:
     53     if artist.get_agg_filter() is not None:


File /usr/lib/python3/dist-packages/matplotlib/image.py:641, in _ImageBase.draw(self, renderer, *args, **kwargs)
    639         renderer.draw_image(gc, l, b, im, trans)
    640 else:
--> 641     im, l, b, trans = self.make_image(
    642         renderer, renderer.get_image_magnification())
    643     if im is not None:
    644         renderer.draw_image(gc, l, b, im)


File /usr/lib/python3/dist-packages/matplotlib/image.py:949, in AxesImage.make_image(self, renderer, magnification, unsampled)
    946 transformed_bbox = TransformedBbox(bbox, trans)
    947 clip = ((self.get_clip_box() or self.axes.bbox) if self.get_clip_on()
    948         else self.figure.bbox)
--> 949 return self._make_image(self._A, bbox, transformed_bbox, clip,
    950                         magnification, unsampled=unsampled)


File /usr/lib/python3/dist-packages/matplotlib/image.py:553, in _ImageBase._make_image(self, A, in_bbox, out_bbox, clip_bbox, magnification, unsampled, round_to_pixel_border)
    551     A = _rgb_to_rgba(A)
    552 alpha = self._get_scalar_alpha()
--> 553 output_alpha = _resample(  # resample alpha channel
    554     self, A[..., 3], out_shape, t, alpha=alpha)
    555 output = _resample(  # resample rgb channels
    556     self, _rgb_to_rgba(A[..., :3]), out_shape, t, alpha=alpha)
    557 output[..., 3] = output_alpha  # recombine rgb and alpha


File /usr/lib/python3/dist-packages/matplotlib/image.py:207, in _resample(image_obj, data, out_shape, transform, resample, alpha)
    205 if resample is None:
    206     resample = image_obj.get_resample()
--> 207 _image.resample(data, out, transform,
    208                 _interpd_[interpolation],
    209                 resample,
    210                 alpha,
    211                 image_obj.get_filternorm(),
    212                 image_obj.get_filterrad())
    213 return out


ValueError: Unsupported dtype
<Figure size 800x400 with 2 Axes>
霍夫椭圆变换速度非常慢,应避免图像太大。