>>> from env_helper import info; info()
页面更新时间: 2023-06-24 12:26:22
运行环境:
    Linux发行版本: Debian GNU/Linux 12 (bookworm)
    操作系统内核: Linux-6.1.0-9-amd64-x86_64-with-glibc2.36
    Python版本: 3.11.2
2.4. 图像自动阈值分割
图像阈值分割是一种广泛应用的分割技术,利用图像中要提取的目标区域与其背景在灰度特性上的差异, 把图像看作具有不同灰度级的两类区域(目标区域和背景区域)的组合, 选取一个比较合理的阈值,以确定图像中每个像素点应该属于目标区域还是背景区域,从而产生相应的二值图像。
在skimage库中,阈值分割的功能是放在filters模块中。
我们可以手动指定一个阈值,从而来实现分割。也可以让系统自动生成一个阈值,下面几种方法就是用来自动生成阈值。
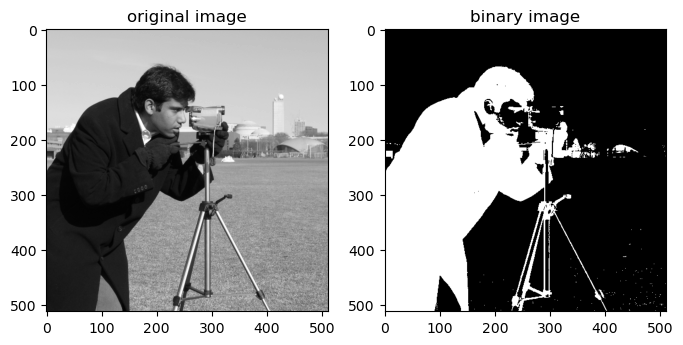
2.4.1. threshold_otsu
基于 Otsu 的阈值分割方法,函数调用格式:
skimage.filters.threshold_otsu(image, nbins=256)
参数image是指灰度图像,返回一个阈值。
>>> from skimage import data,filters
>>> import matplotlib.pyplot as plt
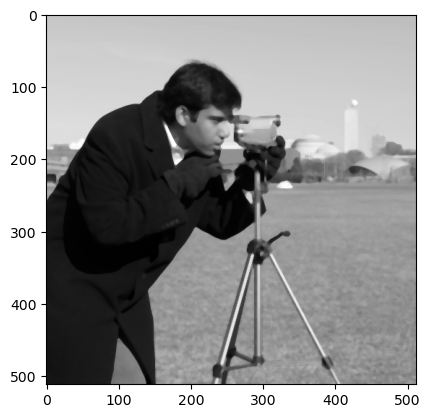
>>> image = data.camera()
>>> thresh = filters.threshold_otsu(image) #返回一个阈值
>>> dst =(image <= thresh)*1.0 #根据阈值进行分割
>>>
>>> plt.figure('thresh',figsize=(8,8))
>>>
>>> plt.subplot(121)
>>> plt.title('original image')
>>> plt.imshow(image,plt.cm.gray)
>>>
>>> plt.subplot(122)
>>> plt.title('binary image')
>>> plt.imshow(dst,plt.cm.gray)
>>>
>>> plt.show()
2.4.2. threshold_yen
使用方法同上:
thresh = filters.threshold_yen(image)
>>> from skimage import data,filters
>>> import matplotlib.pyplot as plt
>>> image = data.camera()
>>>
>>> thresh = filters.threshold_yen(image)
>>>
>>> dst =(image <= thresh)*1.0
>>>
>>> plt.figure('thresh',figsize=(8,8))
>>>
>>> plt.subplot(121)
>>> plt.title('original image')
>>> plt.imshow(image,plt.cm.gray)
>>>
>>> plt.subplot(122)
>>> plt.title('binary image')
>>> plt.imshow(dst,plt.cm.gray)
>>>
>>> plt.show()
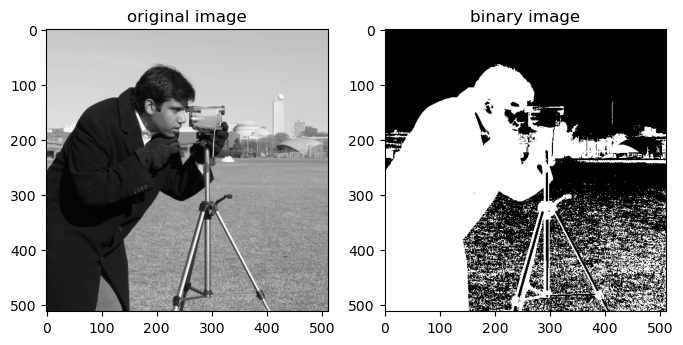
返回阈值为198,分割如下图:
2.4.3. threshold_li
使用方法同上:
thresh = filters.threshold_li(image)
>>> thresh = filters.threshold_li(image)
>>>
>>> dst =(image <= thresh)*1.0
>>>
>>> plt.figure('thresh',figsize=(8,8))
>>>
>>> plt.subplot(121)
>>> plt.title('original image')
>>> plt.imshow(image,plt.cm.gray)
>>>
>>> plt.subplot(122)
>>> plt.title('binary image')
>>> plt.imshow(dst,plt.cm.gray)
>>>
>>> plt.show()
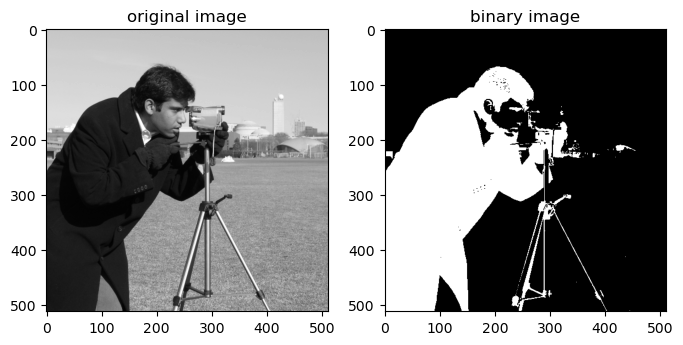
返回阈值64.5,分割如下图:
2.4.4. threshold_isodata
阈值计算方法:
threshold = (image[image <= threshold].mean() +image[image > threshold].mean()) / 2.0
使用方法同上:
>>> thresh = filters.threshold_isodata(image)
>>> dst =(image <= thresh)*1.0
>>>
>>> plt.figure('thresh',figsize=(8,8))
>>>
>>> plt.subplot(121)
>>> plt.title('original image')
>>> plt.imshow(image,plt.cm.gray)
>>>
>>> plt.subplot(122)
>>> plt.title('binary image')
>>> plt.imshow(dst,plt.cm.gray)
>>>
>>> plt.show()
>>> #返回阈值为87,因此分割效果和threshold_otsu一样。

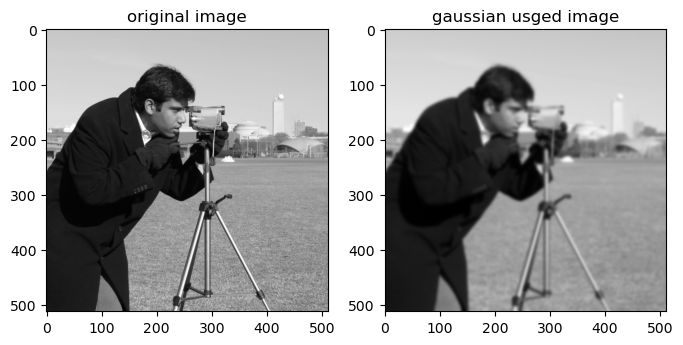
2.4.5. threshold_local
这个函数取代了旧版本中的 threshold_adaptive , 用法稍有不同,注意。
threshold_adaptive was deprecated in 0.13 and removed in 0.15 in favor of threshold_local.
调用函数为:
skimage.filters.threshold_adaptive(image, block_size, method='gaussian')
block_size: 块大小,指当前像素的相邻区域大小,一般是奇数(如3,5,7。。。)
method: 用来确定自适应阈值的方法,有’mean’, ‘generic’, ‘gaussian’ 和 ‘median’。省略时默认为gaussian
该函数直接访问一个阈值后的图像,而不是阈值。
>>> from skimage import data,filters
>>> import matplotlib.pyplot as plt
>>> image = data.camera()
>>> dst =filters.threshold_local(image, 15) #返回一个阈值图像
>>>
>>> plt.figure('thresh',figsize=(8,8))
>>>
>>> plt.subplot(121)
>>> plt.title('original image')
>>> plt.imshow(image,plt.cm.gray)
>>>
>>> plt.subplot(122)
>>> plt.title('gaussian usged image')
>>> plt.imshow(dst,plt.cm.gray)
>>>
>>> plt.show()
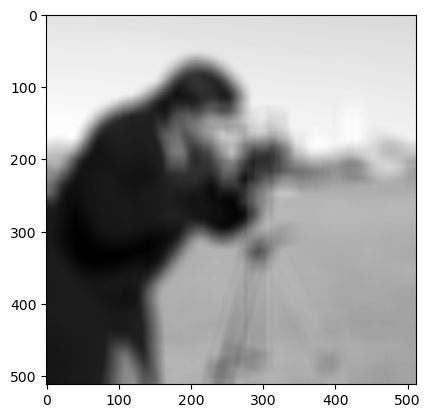
大家可以修改block_size的大小和method值来查看更多的效果。如:
>>> dst1 =filters.threshold_local(image,31,'mean')
>>> plt.imshow(dst1,plt.cm.gray)
>>>
>>> plt.show()
>>> dst2 =filters.threshold_local(image,5,'median')
>>> plt.imshow(dst2,plt.cm.gray)
>>>
>>> plt.show()