6.53. 2010 Africa Education Index Distribution Map#
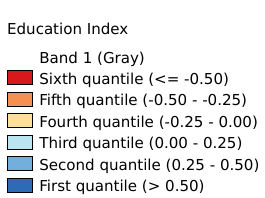
The “education index” represents the potential of a population to access information and knowledge in a certain area in 2010. Such potential is measured by the capacity of educational system and the diffusion of knowledge about events that impacts local population (as likely climate change will do). The index results from the second cluster of the Principal Component Analysis preformed among 16 potential variables. The analysis identify three dominant variables, namely “adult literacy”, “primary gross enrolment rate” and “prevalence of HIV”, assigning respectively the weights of 0.40, 0.25 and 0.35. Before to perform the analysis all the variables were log transformed (except “primary gross enrolment rate”) to shorten the extreme variation and then were score-standardized (converted to distribution with average of 0 and standard deviation of 1; with inverse method for “prevalence of HIV”) in order to be comparable. Data in raster format (resolution 0.5 arc-minute). Coordinate system: WGS 84. Data source: https://data.apps.fao.org/map/catalog/srv/eng/catalog.search#/metadata/6bee0d80-e000-45b5-a7e6-ca5cb296e7af
Legend:#
Information:#
Path : /pb1/gisws/qgis_pub_map/svr_w24/shenjl_rsync/ch80_shenjl/sec09_Social_Economic/ClimAfr21_education_index/pub_Afr_edu_index.qgz
Layer Name : pub_Afr_edu_index_qn2934
Layer ID : qn2934
Center : 1.2541667, 17.004168
Zoom : 3