6.12. 2010 China GDP Distribution Map#
The kilometer grid dataset of China's GDP spatial distribution is based on the national GDP statistical data of counties. It comprehensively analyzes the spatial interaction patterns between land use types, nighttime light brightness, and residential density data closely related to human activities and GDP, and establishes relationship models between the three and GDP. This dataset reflects the detailed spatial distribution of GDP data nationwide. This data is a grid data type, with each grid representing the total GDP output value within the grid range (1 square kilometer), in yuan/square kilometer. The data format is Gird, and the data is based on the Krassovsky ellipsoid using the Albers projection method. Data source: https://geodata.pku.edu.cn/index.php?c=content&a=show&id=710
Legend:#
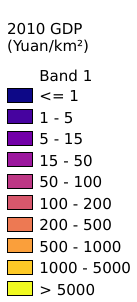
Information:#
Path : /pb1/gisws/qgis_pub_map/svr_w24/shenjl_rsync/ch80_shenjl/sec09_Social_Economic/2005_2010_china_GDP/pub_2005_2010_china_gdp.qgz
Layer Name : pub_2010_china_gdp_qn5638
Layer ID : qn5638
Center : 26.35949, -0.33561122
Zoom : 3