6.52. 2010 Africa Conflictuality index Distribution Map#
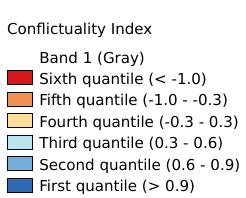
The “conflictuality index” describes the impact that conflicts have in a certain area in 2010. Area subjected to violence and conflict may have problem to receive assistance to develop adaptation measures and may lack the wiliness of the authority to implement such adaptation. The index results from the second cluster of the Principal Component Analysis preformed among 18 potential variables. The analysis identifies two dominant variables, namely “distance from conflict events” and “conflict events density”, assigning equal weights (0.5) to the two variables. Before to perform the analysis the variables were log transformed to shorten the extreme variation and then were score-standardized (converted to distribution with average of 0 and standard deviation of 1; inverse method was applied for “conflicts events density”) in order to be comparable. A shapefile of conflict events was gathered from the Uppsala Conflict Data Programme (UCDP). Considering that the effect of conflict aftermath may during years, we collect all the events position and number of victims from 1989 to 2010. The “distance from conflicts” was obtained via Euclidean distance calculation of the conflict events. The “conflict events density” is the result of a kernel density analysis on number of victims with a search radius of 200 Kilometer. Coordinate system: WGS 84. Data source: https://data.apps.fao.org/map/catalog/srv/eng/catalog.search#/metadata/b9da4f4b-0484-414c-b6e4-f05671901fdf
Legend:#
Information:#
Path : /pb1/gisws/qgis_pub_map/svr_w24/shenjl_rsync/ch80_shenjl/sec09_Social_Economic/ClimAfr27_conflictuality_index/pub_Afr_conflictuality_index.qgz
Layer Name : pub_Afr_conflictuality_index_qn7038
Layer ID : qn7038
Center : 1.25, 17.004168
Zoom : 3