1.8. 交叉分解#
交叉分解模块包含 supervised 降维和回归的估计器,属于“偏最小平方”族。

交叉分解算法找到两个矩阵(X和Y)之间的基本关系。它们是对这两个空间中的协方差结构建模的潜在变量方法。他们将尝试找到X空间中的多维方向,以解释Y空间中的最大多维方差方向。换句话说,APL既预测了两者 X 和 Y 进入较低维子空间,使得之间的协方差 transformed(X) 和 transformed(Y) 最大。
APL与之有相似之处 Principal Component Regression (PCR),其中样本首先被投影到低维子空间中,而目标 y 使用预测 transformed(X) . PCR的一个问题是,维度缩减是无监督的,并且可能会丢失一些重要的变量:PCR会保留方差最大的特征,但方差较小的特征可能与预测目标相关。在某种程度上,最大化标准化允许进行相同的维度缩减,但通过考虑目标 y .以下示例说明了这一事实:* 主成分回归与偏最小平方回归 .
除了PCA之外,当预测矩阵的变量多于观察值时,并且当特征之间存在多重共线性时,最大限度方差估计器特别适合。相比之下,标准线性回归在这些情况下将失败,除非它被正规化。
此模块中包含的类包括 PLSRegression , PLSCanonical , CCA 和 PLSSVD
1.8.1. PLSCanonical#
我们在这里描述中使用的算法 PLSCanonical .其他估计器使用该算法的变体,详细说明如下。我们推荐部分 [1] 了解这些算法之间的更多细节和比较。在 [1], PLSCanonical 对应于“PLSW 2A”。
Given two centered matrices \(X \in \mathbb{R}^{n \times d}\) and
\(Y \in \mathbb{R}^{n \times t}\), and a number of components \(K\),
PLSCanonical proceeds as follows:
Set \(X_1\) to \(X\) and \(Y_1\) to \(Y\). Then, for each \(k \in [1, K]\):
a) compute \(u_k \in \mathbb{R}^d\) and \(v_k \in \mathbb{R}^t\), the first left and right singular vectors of the cross-covariance matrix \(C = X_k^T Y_k\). \(u_k\) and \(v_k\) are called the weights. By definition, \(u_k\) and \(v_k\) are chosen so that they maximize the covariance between the projected \(X_k\) and the projected target, that is \(\text{Cov}(X_k u_k, Y_k v_k)\).
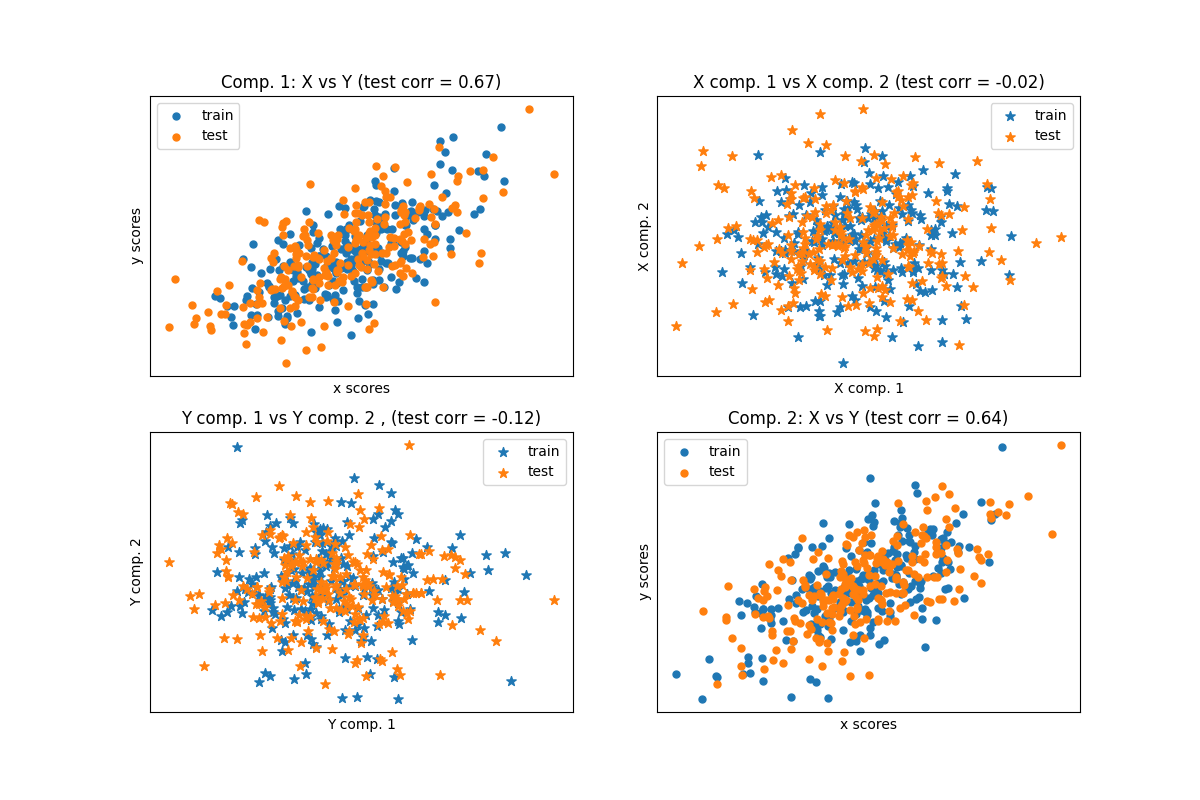
b)项目 \(X_k\) 和 \(Y_k\) 在奇异向量上, scores : \(\xi_k = X_k u_k\) 和 \(\omega_k = Y_k v_k\)
c) Regress \(X_k\) on \(\xi_k\), i.e. find a vector \(\gamma_k \in \mathbb{R}^d\) such that the rank-1 matrix \(\xi_k \gamma_k^T\) is as close as possible to \(X_k\). Do the same on \(Y_k\) with \(\omega_k\) to obtain \(\delta_k\). The vectors \(\gamma_k\) and \(\delta_k\) are called the loadings.
d) deflate \(X_k\) and \(Y_k\), i.e. subtract the rank-1 approximations: \(X_{k+1} = X_k - \xi_k \gamma_k^T\), and \(Y_{k + 1} = Y_k - \omega_k \delta_k^T\).
At the end, we have approximated \(X\) as a sum of rank-1 matrices: \(X = \Xi \Gamma^T\) where \(\Xi \in \mathbb{R}^{n \times K}\) contains the scores in its columns, and \(\Gamma^T \in \mathbb{R}^{K \times d}\) contains the loadings in its rows. Similarly for \(Y\), we have \(Y = \Omega \Delta^T\).
请注意,分数矩阵 \(\Xi\) 和 \(\Omega\) 与训练数据的投影相对应 \(X\) 和 \(Y\) ,分别。
步骤 a) 可以通过两种方式执行:要么通过计算的整个奇异值 \(C\) 并且仅保留具有最大奇异值的奇异分量,或者通过使用乘方法直接计算奇异分量(参见中的11.3节 [1]) ,对应于 'nipals' 选项 algorithm 参数.
变换数据#
To transform \(X\) into \(\bar{X}\), we need to find a projection
matrix \(P\) such that \(\bar{X} = XP\). We know that for the
training data, \(\Xi = XP\), and \(X = \Xi \Gamma^T\). Setting
\(P = U(\Gamma^T U)^{-1}\) where \(U\) is the matrix with the
\(u_k\) in the columns, we have \(XP = X U(\Gamma^T U)^{-1} = \Xi
(\Gamma^T U) (\Gamma^T U)^{-1} = \Xi\) as desired. The rotation matrix
\(P\) can be accessed from the x_rotations_ attribute.
同样, \(Y\) 可以使用旋转矩阵进行转换 \(V(\Delta^T V)^{-1}\) ,通过 y_rotations_ 属性
预测目标 Y#
To predict the targets of some data \(X\), we are looking for a coefficient matrix \(\beta \in R^{d \times t}\) such that \(Y = X\beta\).
The idea is to try to predict the transformed targets \(\Omega\) as a function of the transformed samples \(\Xi\), by computing \(\alpha \in \mathbb{R}\) such that \(\Omega = \alpha \Xi\).
Then, we have \(Y = \Omega \Delta^T = \alpha \Xi \Delta^T\), and since \(\Xi\) is the transformed training data we have that \(Y = X \alpha P \Delta^T\), and as a result the coefficient matrix \(\beta = \alpha P \Delta^T\).
\(\beta\) 可以通过 coef_ 属性
1.8.2. PLSSVD#
PLSSVD 是的简化版本 PLSCanonical 前面描述过:而不是迭代缩小矩阵 \(X_k\) 和 \(Y_k\) , PLSSVD 计算的MVD \(C = X^TY\) 只 once ,并存储 n_components 对应于矩阵中最大奇异值的奇异载体 U 和 V ,对应于 x_weights_ 和 y_weights_ 美德.先知-愿在这里,转换后的数据只是 transformed(X) = XU 和 transformed(Y) = YV .
如果 n_components == 1 , PLSSVD 和 PLSCanonical 严格等效。
1.8.3. PLSRegression#
的 PLSRegression 估计器类似于 PLSCanonical 与 algorithm='nipals' ,有2个显着差异:
在步骤a)中的乘势法计算 \(u_k\) 和 \(v_k\) , \(v_k\) 从未正常化。
在步骤c)中,目标 \(Y_k\) 使用投影来逼近 \(X_k\) (即 \(\xi_k\) )而不是投影 \(Y_k\) (即 \(\omega_k\) ).换句话说,载荷计算不同。因此,步骤d)中的通货紧缩也将受到影响。
这两个修改影响的产量 predict 和 transform ,与 PLSCanonical .此外,虽然组件数量受到限制 min(n_samples, n_features, n_targets) 在 PLSCanonical ,这里的极限是 \(X^TX\) ,即 min(n_samples, n_features) .
PLSRegression 也称为SCS 1(单目标)和SCS 2(多目标)。很像 Lasso , PLSRegression 是一种正规化线性回归的形式,其中成分的数量控制正规化的强度。
1.8.4. 典型相关分析#
典型相关分析是在最大限度方差分析之前开发的。但事实证明 CCA 是PLS的一种特殊情况,对应于文献中“模式B”中的PLS。
CCA 不同于 PLSCanonical 重量的方式 \(u_k\) 和 \(v_k\) 以步骤a)的乘方法计算。详细信息请参阅第10节 [1].
以来 CCA 涉及的倒置 \(X_k^TX_k\) 和 \(Y_k^TY_k\) ,如果特征或目标的数量大于样本的数量,则该估计器可能不稳定。
引用
示例
