
一维样条曲线模型#
Spline1D 模型是可用于将分段多项式拟合到一组数据的模型。这意味着样条线与用于将样条线拟合到数据的方法紧密相关。目前,我们提供了三种将样条线拟合到数据的方法:
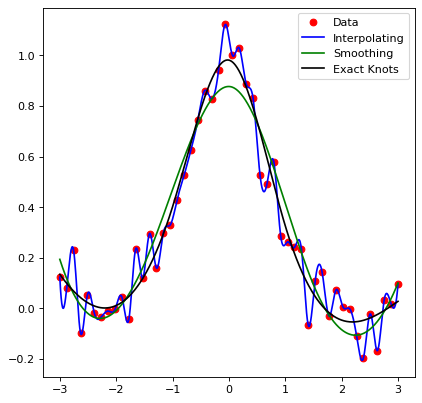
SplineInterpolateFitter,它用一条插值样条线来拟合数据。这意味着样条线将精确地拟合所有数据点。SplineSmoothingFitter,它将一条平滑样条线拟合到数据。这意味着选择节点数以满足“平滑条件”:\[\sum_{i} \left(w_i * (y_i - spl(x_i))\right)^{2} \leq s\]SplineExactKnotsFitter,它使用一组精确的节点将样条线拟合到数据。这意味着样条线将使用最小二乘回归,使用用户提供的(内部)结来查找最适合数据的样条线。
import numpy as np
import matplotlib.pyplot as plt
from astropy.modeling.models import Spline1D
from astropy.modeling.fitting import (SplineInterpolateFitter,
                                      SplineSmoothingFitter,
                                      SplineExactKnotsFitter)

rng = np.random.default_rng()
x = np.linspace(-3, 3, 50)
y = np.exp(-x**2) + 0.1 * rng.standard_normal(50)
xs = np.linspace(-3, 3, 1000)
t = [-1, 0, 1]
spl = Spline1D()

fitter = SplineInterpolateFitter()
spl1 = fitter(spl, x, y)

fitter = SplineSmoothingFitter()
spl2 = fitter(spl, x, y, s=0.5)

fitter = SplineExactKnotsFitter()
spl3 = fitter(spl, x, y, t=t)

plt.plot(x, y, 'ro', label="Data")
plt.plot(xs, spl1(xs), 'b-', label="Interpolating")
plt.plot(xs, spl2(xs), 'g-', label="Smoothing")
plt.plot(xs, spl3(xs), 'k-', label="Exact Knots")
plt.legend()
plt.show()
请注意,默认情况下,样条线具有 degree 3.对于这些样条线, degree - 1 是样条线跨结点匹配的导数的数量。因此,对于3阶样条线,样条线的值、一阶和二阶导数将在每个结点上匹配。
警告
样条线仅支持整数度,因此 1 <= degree <= 5 。