

装配线#
将一条线拟合到(x,y)数据点是许多领域的常见情况。文中给出了拟合实例,用不确定度作为权重进行拟合,用迭代西格玛剪裁进行拟合。
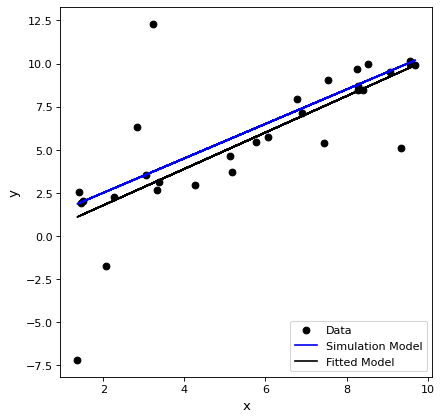
简单合身#
这里的(x,y)数据点与直线拟合。对(x,y)数据点进行了模拟,并给出了一个具有一定不确定性的实例。
import numpy as np
import matplotlib.pyplot as plt
from astropy.modeling import models, fitting

# define a model for a line
line_orig = models.Linear1D(slope=1.0, intercept=0.5)

# generate x, y data non-uniformly spaced in x
# add noise to y measurements
npts = 30
rng = np.random.default_rng(10)
x = rng.uniform(0.0, 10.0, npts)
y = line_orig(x)
yunc = np.absolute(rng.normal(0.5, 2.5, npts))
y += rng.normal(0.0, yunc, npts)

# initialize a linear fitter
fit = fitting.LinearLSQFitter()

# initialize a linear model
line_init = models.Linear1D()

# fit the data with the fitter
fitted_line = fit(line_init, x, y)

# plot
fig, ax = plt.subplots()
ax.plot(x, y, 'ko', label='Data')
ax.plot(x, line_orig(x), 'b-', label='Simulation Model')
ax.plot(x, fitted_line(x), 'k-', label='Fitted Model')
ax.set(xlabel='x', ylabel='y')
ax.legend()

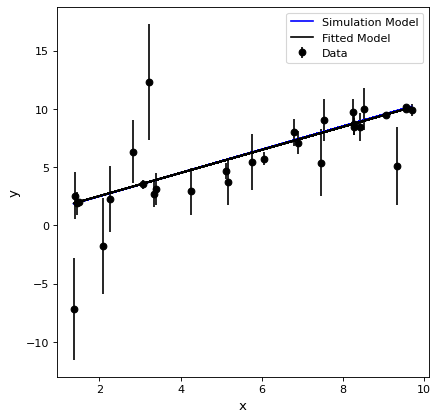
使用不确定性拟合#
可以使用不确定度作为权重进行拟合。对于高斯误差,要得到1/unc^2的标准权重,传递给拟合的权重为1/unc。
import numpy as np
import matplotlib.pyplot as plt
from astropy.modeling import models, fitting

# define a model for a line
line_orig = models.Linear1D(slope=1.0, intercept=0.5)

# generate x, y data non-uniformly spaced in x
# add noise to y measurements
npts = 30
rng = np.random.default_rng(10)
x = rng.uniform(0.0, 10.0, npts)
y = line_orig(x)
yunc = np.absolute(rng.normal(0.5, 2.5, npts))
y += rng.normal(0.0, yunc, npts)

# initialize a linear fitter
fit = fitting.LinearLSQFitter()

# initialize a linear model
line_init = models.Linear1D()

# fit the data with the fitter
fitted_line = fit(line_init, x, y, weights=1.0/yunc)

# plot
fig, ax = plt.subplots()
ax.errorbar(x, y, yerr=yunc, fmt='ko', label='Data')
ax.plot(x, line_orig(x), 'b-', label='Simulation Model')
ax.plot(x, fitted_line(x), 'k-', label='Fitted Model')
ax.set(xlabel='x', ylabel='y')
ax.legend()

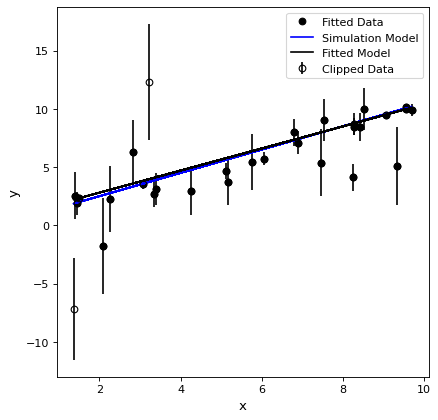
sigma裁剪迭代拟合#
拟合时,可能存在拟合中的离群值数据,这些数据可能会显著偏离拟合。这些离群值可以被识别,并从拟合中迭代删除。注意,迭代西格玛剪裁假设所有数据对于西格玛裁剪决策具有相同的不确定性。
import numpy as np
import matplotlib.pyplot as plt
from astropy.stats import sigma_clip
from astropy.modeling import models, fitting

# define a model for a line
line_orig = models.Linear1D(slope=1.0, intercept=0.5)

# generate x, y data non-uniformly spaced in x
# add noise to y measurements
npts = 30
rng = np.random.default_rng(10)
x = rng.uniform(0.0, 10.0, npts)
y = line_orig(x)
yunc = np.absolute(rng.normal(0.5, 2.5, npts))
y += rng.normal(0.0, yunc, npts)

# make true outliers
y[3] = line_orig(x[3]) + 6 * yunc[3]
y[10] = line_orig(x[10]) - 4 * yunc[10]

# initialize a linear fitter
fit = fitting.LinearLSQFitter()

# initialize the outlier removal fitter
or_fit = fitting.FittingWithOutlierRemoval(fit, sigma_clip, niter=3, sigma=3.0)

# initialize a linear model
line_init = models.Linear1D()

# fit the data with the fitter
fitted_line, mask = or_fit(line_init, x, y, weights=1.0/yunc)
filtered_data = np.ma.masked_array(y, mask=mask)

# plot
fig, ax = plt.subplots()
ax.errorbar(x, y, yerr=yunc, fmt="ko", fillstyle="none", label="Clipped Data")
ax.plot(x, filtered_data, "ko", label="Fitted Data")
ax.plot(x, line_orig(x), 'b-', label='Simulation Model')
ax.plot(x, fitted_line(x), 'k-', label='Fitted Model')
ax.set(xlabel='x', ylabel='y')
ax.legend()
