
JointFitter#
在某些情况下,人们可能希望将多个数据集与共享参数的模型相匹配。这可以通过使用 astropy.modeling.fitting.JointFitter 。基本上,该修配器设置有一系列已定义的模型、不同模型之间通用的参数以及这些参数的初始值。然后,安装工被称为提供尽可能多的x和y数组,每个要适合的模型一个。拟合参数是将模型联合拟合到组合数据集的结果。
备注
JointFitter使用scipy.Optimize.leastsq。此外,它目前不支持固定参数、绑定参数或绑定参数。
示例:光谱线#
该示例用于具有不同光谱分辨率的两个光谱段,它们在两个段之间重叠的波长区域中具有相同的光谱线。
我们需要定义一个具有平均波长、面积和宽度参数的高斯函数。这是所需的 astropy.modeling.functional_models.Gaussian1D 函数具有平均波长、中心强度和宽度参数,但在不同的光谱分辨率下,一条线的中心强度会不同,但面积将是相同的。
首先,本例需要导入
>>> # imports
>>> import math
>>> import numpy as np
>>> from astropy.modeling import fitting, Fittable1DModel
>>> from astropy.modeling.parameters import Parameter
>>> from astropy.modeling.functional_models import FLOAT_EPSILON
现在,使用面积而不是强度作为参数定义AreaGaussian1D。这个新的模型是标准的Gaussian1D模型的修改和修剪版本。
>>> class AreaGaussian1D(Fittable1DModel):
...   """
...   One dimensional Gaussian model with area as a parameter.
...
...   Parameters
...   ----------
...   area : float or `~astropy.units.Quantity`.
...       Integrated area
...       Note: amplitude = area / (stddev * np.sqrt(2 * np.pi))
...   mean : float or `~astropy.units.Quantity`.
...       Mean of the Gaussian.
...   stddev : float or `~astropy.units.Quantity`.
...       Standard deviation of the Gaussian with FWHM = 2 * stddev * np.sqrt(2 * np.log(2)).
...   """
...   area = Parameter(default=1)
...   mean = Parameter(default=0)
...
...   # Ensure stddev makes sense if its bounds are not explicitly set.
...   # stddev must be non-zero and positive.
...   stddev = Parameter(default=1, bounds=(FLOAT_EPSILON, None))
...
...   @staticmethod
...   def evaluate(x, area, mean, stddev):
...       """
...       AreaGaussian1D model function.
...       """
...       return (area / (stddev * np.sqrt(2 * np.pi))) * np.exp(
...           -0.5 * (x - mean) ** 2 / stddev ** 2
...       )
模拟了拟合出的数据。第一个光谱段的光谱分辨率将比第二个段高2倍。第一段的波长从1到6,第二段的波长从4到10,从而产生从4到6的重叠波长区域。
>>> # Generate fake data
>>> mean = 5.1
>>> sigma1 = 0.2
>>> sigma2 = 0.4
>>> noise = 0.10
>>> # compute the central amplitudes so the lines in each segment have the
>>> # same area
>>> area = 1.5
>>> amp1 = area / np.sqrt(2.0 * math.pi * sigma1 ** 2)
>>> amp2 = area / np.sqrt(2.0 * math.pi * sigma2 ** 2)
>>> # segment 1
>>> rng = np.random.default_rng(147)
>>> x1 = np.linspace(1.0, 6.0, 200)
>>> y1 = amp1 * np.exp(-0.5 * (x1 - mean) ** 2 / sigma1 ** 2)
>>> y1 += rng.normal(0.0, noise, x1.shape)
>>> # segment 2
>>> x2 = np.linspace(4.0, 10.0, 200)
>>> y2 = amp2 * np.exp(-0.5 * (x2 - mean) ** 2 / sigma2 ** 2)
>>> y2 += rng.normal(0.0, noise, x2.shape)
现在定义适合的模型以及更适合使用的模型。然后对两个模拟数据集进行拟合。
>>> # define the two models to be fit
>>> gjf1 = AreaGaussian1D(area=1.0, mean=5.0, stddev=1.0)
>>> gjf2 = AreaGaussian1D(area=1.0, mean=5.0, stddev=1.0)
>>> # define the jointfitter specifying the parameters in common and their initial values
>>> fit_joint = fitting.JointFitter(
...    [gjf1, gjf2], {gjf1: ["area", "mean"], gjf2: ["area", "mean"]}, [1.0, 5.0]
... )
>>>
>>> # perform the fit
>>> g12 = fit_joint(x1, y1, x2, y2)
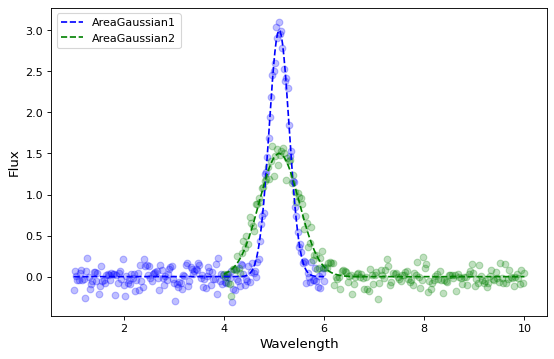
拟合参数表明,两个AreaGaussian1D模型的面积和平均波长完全相同,而宽度(Stddev)不同,反映了两段不同的光谱分辨率。
区域Gaussian1参数
>>> print(gjf1.param_names)
('area', 'mean', 'stddev')
>>> print(gjf1.parameters)
[1.49823951 5.10494811 0.19918164]
区域高斯2参数
>>> print(gjf1.param_names)
('area', 'mean', 'stddev')
>>> print(gjf2.parameters)
[1.49823951 5.10494811 0.39860539]
模拟数据和最佳拟合模型可以作图,表明两个AreaGaussian1D模型和两个光谱段之间有很好的一致性。
