pandas.DataFrame.plot.pie#
- DataFrame.plot.pie(**kwargs)[源代码]#
生成饼图。
饼图是一列中数字数据的比例表示。此函数用于包装
matplotlib.pyplot.pie()用于指定列的。如果没有传递任何列引用,并且subplots=True分别为每个数值列绘制饼图。- 参数
- yInt或Label,可选
要打印的柱的标签或位置。如果未提供,
subplots=True必须传递参数。- **kwargs
要传递到的关键字参数
DataFrame.plot()。
- 退货
- Matplotlib.axs.或其中的np.ndarray
在以下情况下返回NumPy数组 subplots 是真的。
参见
Series.plot.pie为系列生成饼图。
DataFrame.plot对DataFrame进行打印。
示例
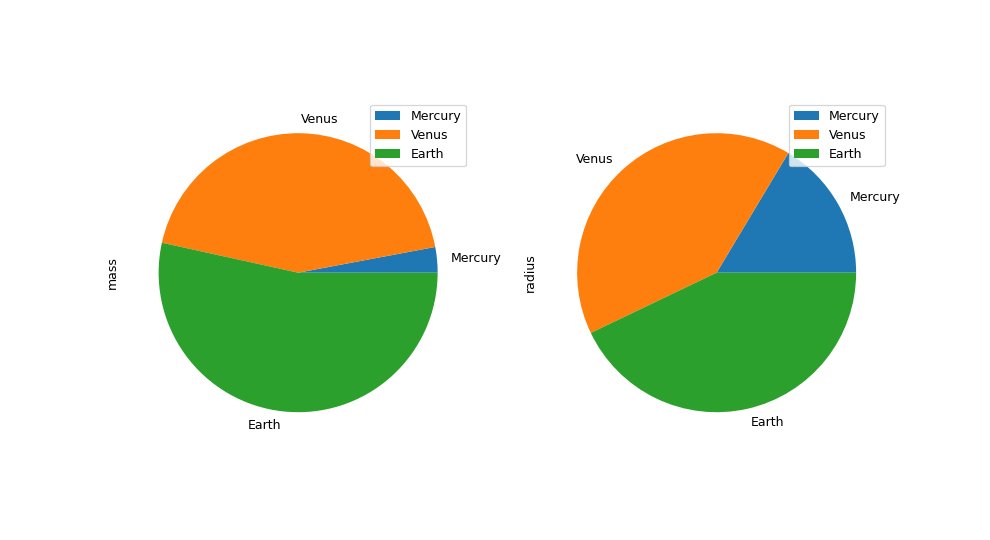
在下面的例子中,我们有一个包含行星质量和半径信息的DataFrame。我们将“MASS”列传递给PIE函数以获得饼图。
>>> df = pd.DataFrame({'mass': [0.330, 4.87 , 5.97],
...                    'radius': [2439.7, 6051.8, 6378.1]},
...                   index=['Mercury', 'Venus', 'Earth'])
>>> plot = df.plot.pie(y='mass', figsize=(5, 5))

>>> plot = df.plot.pie(subplots=True, figsize=(11, 6))