pandas.DataFrame.plot.hexbin#
- DataFrame.plot.hexbin(x, y, C=None, reduce_C_function=None, gridsize=None, **kwargs)[源代码]#
生成一个六角形的装箱图。
生成一个六角形的装箱图 x 与 y 。如果 C 是 None (默认),这是观测出现次数的直方图
(x[i], y[i])。如果 C ,则指定给定坐标上的值。
(x[i], y[i])。为每个六角形面元累加这些值,然后根据 reduce_C_function ,默认具有NumPy的Mean函数 (numpy.mean())。(如果 C ,则它还必须是长度与 x 和 y ,或列标签。)- 参数
- x整型或字符串
X点的列标签或位置。
- y整型或字符串
Y点的列标签或位置。
- Cint或str,可选
的值的列标签或位置 (x, y) 指向。
- reduce_C_function :可调用,默认 np.mean可调用,默认
一个参数的函数,它将bin中的所有值减少到单个数字(例如 np.mean , np.max , np.sum , np.std )。
- gridsizeInt或tuple of(int,int),默认为100
X方向上的六边形的数量。Y方向上相应数量的六边形是以六边形近似为规则的方式选择的。或者,GRIDSIZE可以是具有两个元素的元组,用于指定x方向和y方向上的六边形的数量。
- **kwargs
中记录了其他关键字参数
DataFrame.plot()。
- 退货
- matplotlib.AxesSubplot
Matplotlib
Axes在其上绘制了六角箱。
参见
DataFrame.plot对DataFrame进行打印。
matplotlib.pyplot.hexbin使用matplotlib的六角形装箱图,即在引擎盖下使用的matplotlib函数。
示例
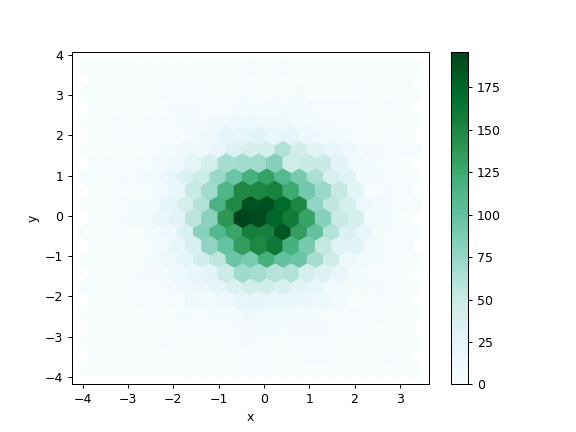
以下示例是使用正态分布中的随机数据生成的。
>>> n = 10000
>>> df = pd.DataFrame({'x': np.random.randn(n),
...                    'y': np.random.randn(n)})
>>> ax = df.plot.hexbin(x='x', y='y', gridsize=20)
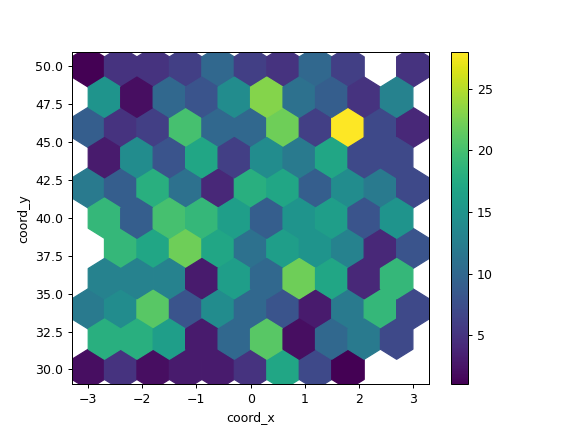
下一个示例使用 C 和 np.sum 作为 reduce_C_function 。请注意, 'observations' 值的范围从1到5,但结果图显示的值最多超过25。这是因为 reduce_C_function 。
>>> n = 500
>>> df = pd.DataFrame({
...     'coord_x': np.random.uniform(-3, 3, size=n),
...     'coord_y': np.random.uniform(30, 50, size=n),
...     'observations': np.random.randint(1,5, size=n)
...     })
>>> ax = df.plot.hexbin(x='coord_x',
...                     y='coord_y',
...                     C='observations',
...                     reduce_C_function=np.sum,
...                     gridsize=10,
...                     cmap="viridis")