>>> from env_helper import info; info()
页面更新时间: 2024-04-09 09:13:22
运行环境:
    Linux发行版本: Debian GNU/Linux 12 (bookworm)
    操作系统内核: Linux-6.1.0-18-amd64-x86_64-with-glibc2.36
    Python版本: 3.11.2
3.4. 使用 RasterIO 作图
3.4.1. 示意
栅格将栅格数据读取到numpy数组中,因此可以直接使用 pyplot .
>>> %matplotlib inline
>>> import rasterio
>>> from matplotlib import pyplot
>>> src = rasterio.open("/gdata/rasterio/444.tiff")
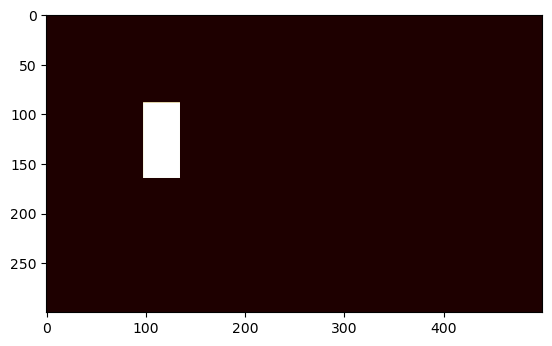
>>> pyplot.imshow(src.read(1), cmap='pink')
>>>
>>> pyplot.show()
/usr/lib/python3/dist-packages/rasterio/__init__.py:304: NotGeoreferencedWarning: Dataset has no geotransform, gcps, or rpcs. The identity matrix will be returned.
  dataset = DatasetReader(path, driver=driver, sharing=sharing, **kwargs)
栅格还提供 rasterio.plot.show
执行常见任务,例如将多波段图像显示为RGB,并用适当的地理参考范围标记轴。
第一个论点 show 表示要绘制的数据源。这可能是
以“r”模式打开的数据集对象
源的单波段,用 (src, band_index) 元组
一个numpy ndarray、2d或3d。如果数组是3d,请确保它是按栅格波段顺序排列的。
因此,以下3波段RGB数据的操作是等效的。请注意,当传递数组时,可以传递一个转换以获取范围标签。
>>> from rasterio.plot import show
>>> show(src)
<AxesSubplot: >
>>> show(src.read(), transform=src.transform)

<AxesSubplot: >
同样,对于单波段图。注意,你可以通过 cmap 指定matplotlib颜色渐变。任何关卡都传给 show 将传递给基础Pyplot函数。
>>> show((src, 1), cmap='viridis')

<AxesSubplot: >
>>> show(src.read(1), transform=src.transform, cmap='viridis')
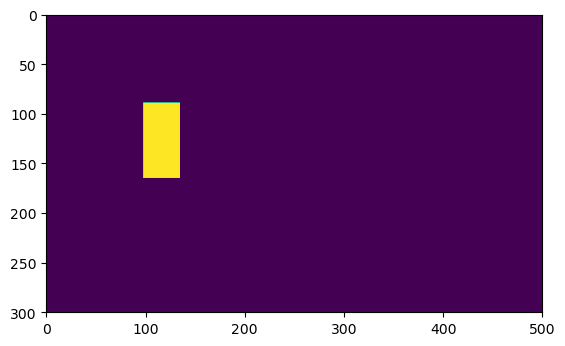
<AxesSubplot: >
3.4.2. 更多参数
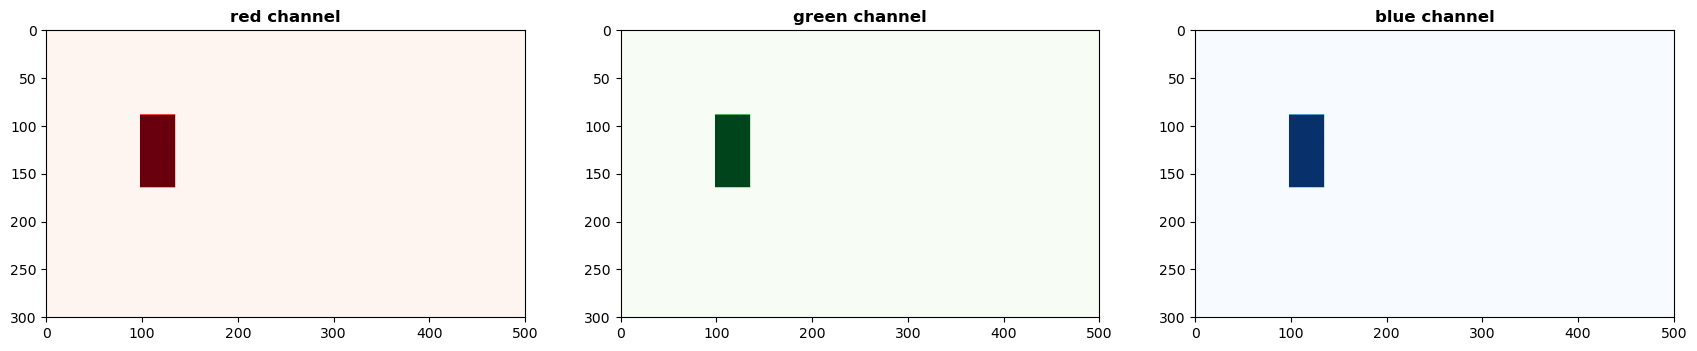
通过传递 show(…, ax=ax1) 参数。还要注意,这个例子演示了如何设置整体图形大小,并为每个子批次设置标题。
>>> fig, (axr, axg, axb) = pyplot.subplots(1,3, figsize=(21,7))
>>> show((src, 1), ax=axr, cmap='Reds', title='red channel')
>>> show((src, 1), ax=axg, cmap='Greens', title='green channel')
>>> show((src, 1), ax=axb, cmap='Blues', title='blue channel')
>>> pyplot.show()
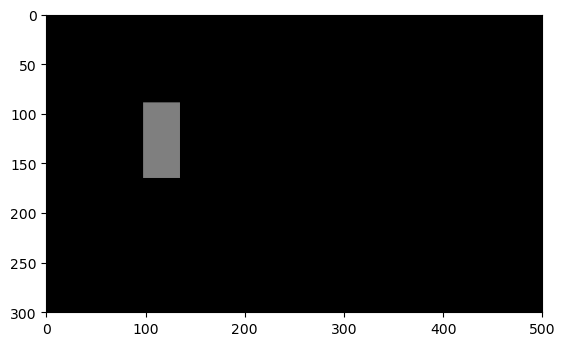
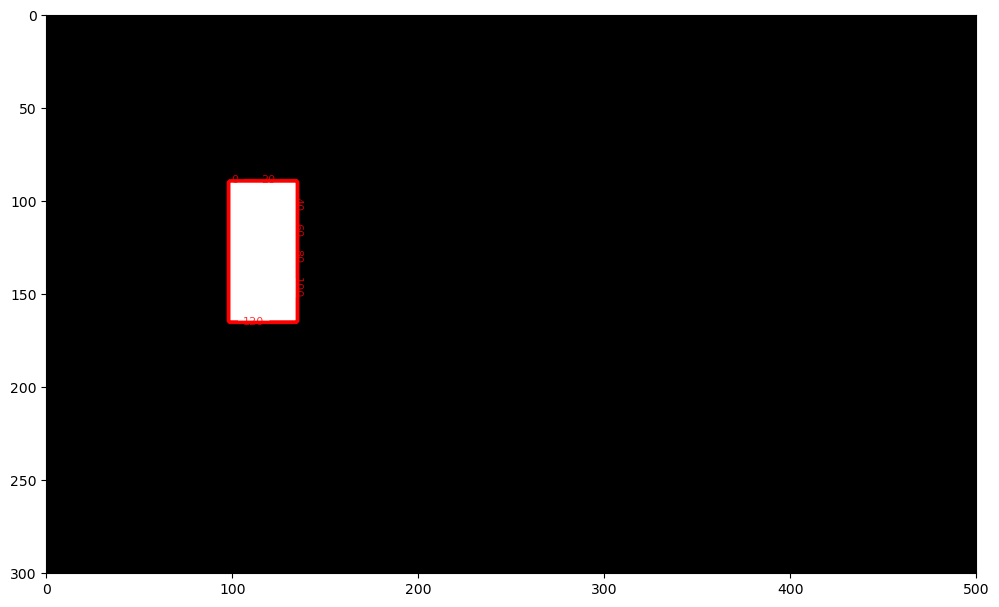
对于单波段栅格,还可以选择生成轮廓。
>>> fig, ax = pyplot.subplots(1, figsize=(12, 12))
>>> show((src, 1), cmap='Greys_r', interpolation='none', ax=ax)
>>>
>>> show((src, 1), contour=True, ax=ax)
>>>
>>> pyplot.show()
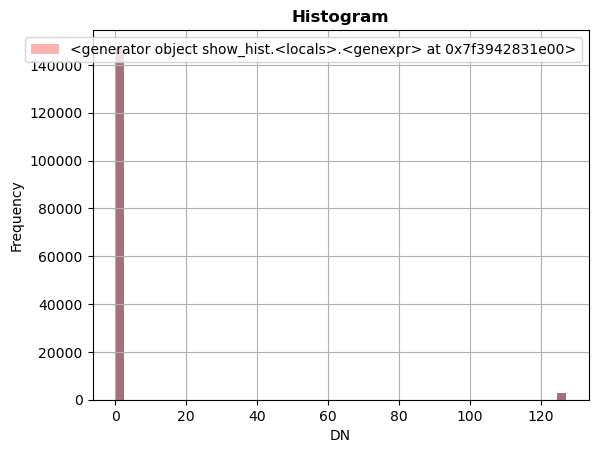
栅格还提供 plot.show_hist 用于生成单波段或多波段栅格柱状图的函数:
>>> from rasterio.plot import show_hist
>>> show_hist(
>>>     src, bins=50, lw=0.0, stacked=False, alpha=0.3,
>>>     histtype='stepfilled', title="Histogram")
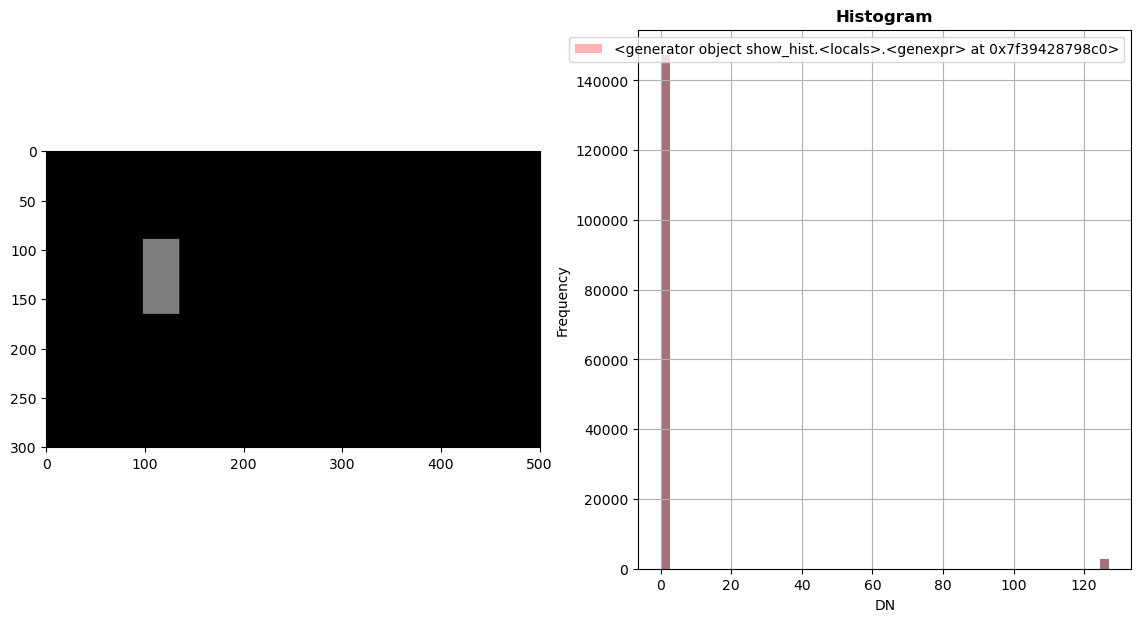
这个 show_hist 函数还需要 ax 允许子批次配置的参数
>>> fig, (axrgb, axhist) = pyplot.subplots(1, 2, figsize=(14,7))
>>> show(src, ax=axrgb)
>>>
>>> show_hist(src, bins=50, histtype='stepfilled',
>>>            lw=0.0, stacked=False, alpha=0.3, ax=axhist)
>>> pyplot.show()