>>> from env_helper import info; info()
页面更新时间: 2024-04-10 15:03:00
运行环境:
    Linux发行版本: Debian GNU/Linux 12 (bookworm)
    操作系统内核: Linux-6.1.0-18-amd64-x86_64-with-glibc2.36
    Python版本: 3.11.2
10.6. 绘制不同区域的方法
继续展示一些其他示例。
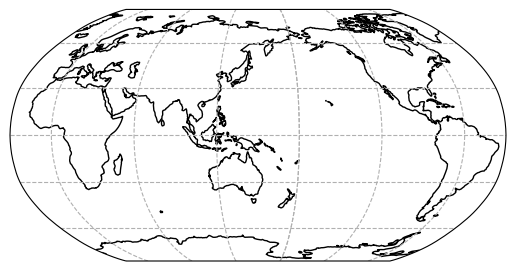
10.6.1. 绘制全球地图
>>> import matplotlib.pyplot as plt
>>> import cartopy.crs as ccrs
>>> # set projection
>>> ax = plt.axes(projection=ccrs.Robinson(central_longitude=150))
>>> # plot coastlines & gridlines
>>> ax.coastlines()
>>> ax.gridlines(linestyle='--')
>>>
>>> plt.show()
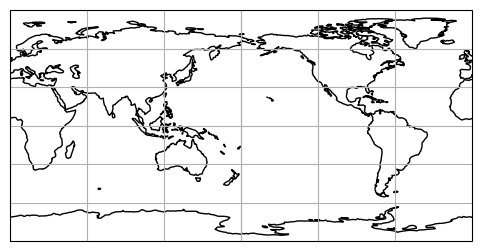
试一个不同的投影:
>>> plt.figure(figsize=(6, 3))
>>> ax = plt.axes(projection=ccrs.PlateCarree(central_longitude=180))
>>> ax.coastlines(resolution='110m')
>>> ax.gridlines()
>>> plt.show()
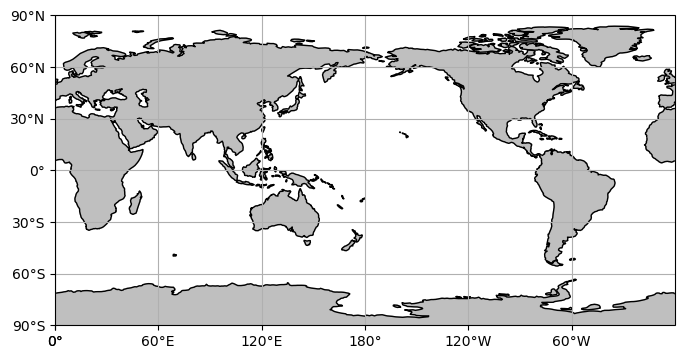
在上图基础上继续完善:
>>> import cartopy.feature as cfeature
>>> from cartopy.mpl.ticker import LongitudeFormatter, LatitudeFormatter
>>>
>>> scale = '110m'
>>> fig = plt.figure(figsize=(8, 10))
>>> ax = plt.axes(projection=ccrs.PlateCarree(central_longitude=180))
>>> ax.set_global()
>>> land = cfeature.NaturalEarthFeature('physical', 'land', scale, edgecolor='face',
>>>                                     facecolor=cfeature.COLORS['land'])
>>> ax.add_feature(land, facecolor='0.75')
>>> ax.coastlines(scale)
>>> # 标注坐标轴
>>> ax.set_xticks([0, 60, 120, 180, 240, 300, 360], crs=ccrs.PlateCarree())
>>> ax.set_yticks([-90, -60, -30, 0, 30, 60, 90], crs=ccrs.PlateCarree())
>>> # zero_direction_label用来设置经度的0度加不加E和W
>>> lon_formatter = LongitudeFormatter(zero_direction_label=False)
>>> lat_formatter = LatitudeFormatter()
>>> ax.xaxis.set_major_formatter(lon_formatter)
>>> ax.yaxis.set_major_formatter(lat_formatter)
>>> # 添加网格线
>>> # gl = ax.gridlines()
>>> ax.grid()
>>> plt.show()
10.6.2. 绘制区域地图
>>> import numpy as np
>>> import matplotlib.pyplot as plt
>>> import cartopy.crs as ccrs
>>> import cartopy.feature as cfeature
>>> from cartopy.mpl.ticker import LongitudeFormatter, LatitudeFormatter
>>>
>>> box = [100, 150, 0, 50]
>>> scale = '50m'
>>> xstep, ystep = 10, 10
>>> fig = plt.figure(figsize=(8, 10))
>>> ax = plt.axes(projection=ccrs.PlateCarree())
>>>
>>> ax.set_extent(box, crs=ccrs.PlateCarree())
>>> land = cfeature.NaturalEarthFeature('physical', 'land', scale, edgecolor='face',
>>>                                     facecolor=cfeature.COLORS['land'])
>>> ax.add_feature(land, facecolor='0.75')
>>> ax.coastlines(scale)
>>>
>>>
>>> ax.stock_img()
>>> # ===================================================
>>> #标注坐标轴
>>> ax.set_xticks(np.arange(box[0], box[1]+xstep,xstep), crs=ccrs.PlateCarree())
>>> ax.set_yticks(np.arange(box[2], box[3]+ystep,ystep), crs=ccrs.PlateCarree())
>>> # zero_direction_label用来设置经度的0度加不加E和W
>>> lon_formatter = LongitudeFormatter(zero_direction_label=False)
>>> lat_formatter = LatitudeFormatter()
>>> ax.xaxis.set_major_formatter(lon_formatter)
>>> ax.yaxis.set_major_formatter(lat_formatter)
>>> # 添加网格线
>>> ax.grid()
>>> plt.show()
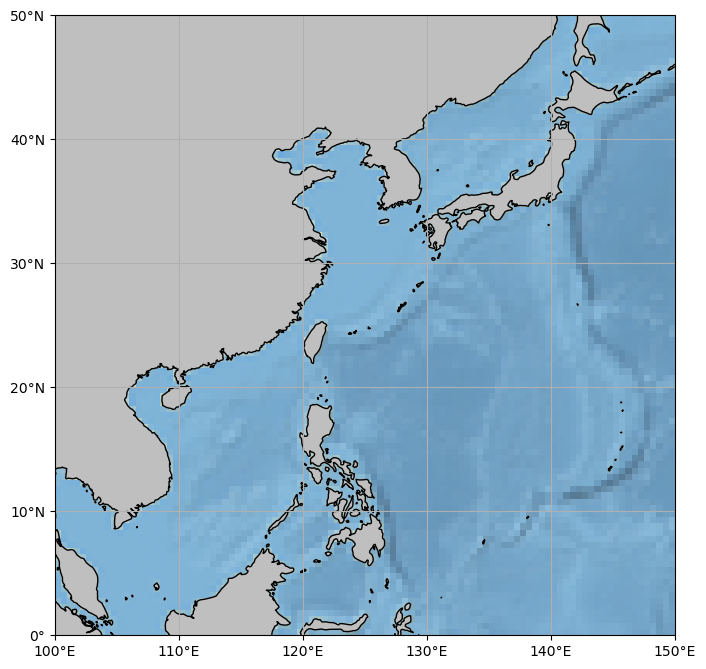
set_extent 需要配置相应的crs,否则出来的地图范围不准确
图像地址
D:\Program Files\WinPython-32bit-2.7.9.3\python-2.7.9\Lib\site-packages\cartopy\data\raster\natural_earth\50-natural-earth-1-downsampled.png
如果有其它高精度图像文件,改名替换即可。
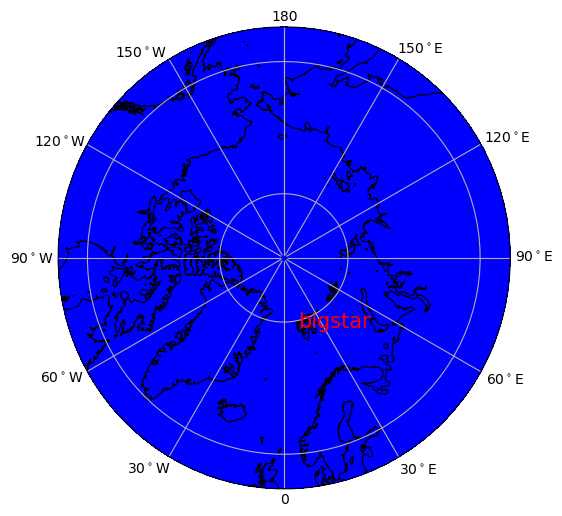
10.6.3. 绘制极地投影地图
>>> import matplotlib.path as mpath
>>> import matplotlib.pyplot as plt
>>> import numpy as np
>>> import matplotlib.ticker as mticker
>>> import cartopy.crs as ccrs
>>> import cartopy.feature as cfeature
>>>
>>> fig = plt.figure(figsize=(6, 6))
>>> ax = plt.axes(projection=ccrs.NorthPolarStereo())
>>> box = [-180, 180, 55, 90]
>>> xstep, ystep = 30, 15
>>> # Limit the map to -60 degrees latitude and below.
>>> ax.set_extent(box, crs=ccrs.PlateCarree())
>>> scale = '50m'
>>> land = cfeature.NaturalEarthFeature('physical', 'land', scale, edgecolor='face',
>>>                                     facecolor=cfeature.COLORS['land'])
>>> ocean = cfeature.NaturalEarthFeature('physical', 'ocean', scale, edgecolor='face',
>>>                                      facecolor=cfeature.COLORS['water'])
>>> ax.add_feature(land, facecolor='0.75')
>>> ax.add_feature(ocean, facecolor='blue')
>>> ax.coastlines(scale, linewidth=0.9)
>>>
>>> # 标注坐标轴
>>>
>>>
>>> line = ax.gridlines(draw_labels=False)
>>>
>>>
>>>
>>> line.ylocator = mticker.FixedLocator(np.arange(40, 90, 20))  # 手动设置x轴刻度
>>> line.xlocator = mticker.FixedLocator(np.arange(-180, 210, 30))  # 手动设置x轴刻度
>>> # Compute a circle in axes coordinates, which we can use as a boundary
>>> # for the map. We can pan/zoom as much as we like - the boundary will be
>>> # permanently circular.
>>> theta = np.linspace(0, 2 * np.pi, 100)
>>> center, radius = [0.5, 0.5], 0.5
>>> verts = np.vstack([np.sin(theta), np.cos(theta)]).T
>>> circle = mpath.Path(verts * radius + center)
>>> ax.set_boundary(circle, transform=ax.transAxes)
>>>
>>> # 创建要标注的labels字符串
>>>
>>> ticks = np.arange(0, 210, 30)
>>> etick = ['0'] + ['%d$^\circ$E' % tick for tick in ticks if (tick != 0) & (tick != 180)] + ['180']
>>> wtick = ['%d$^\circ$W' % tick for tick in ticks if (tick != 0) & (tick != 180)]
>>> labels = etick + wtick
>>> # 创建与labels对应的经纬度标注位置
>>> # xticks=[i for i in np.arange(0,210,30)]+[i for i in np.arange(-32,-180,-30)]
>>> xticks = [-0.8, 28, 58, 89.1, 120, 151, 182.9, -36, -63, -89, -114, -140]
>>> yticks = [53] + [53] + [54] + [55] * 2 + [54.5] + [54] + [50] + [49] * 3 + [50.6]
>>>
>>> # 标注经纬度
>>> # ax.text(0.01,0.23,'60$^\circ$W',transform=ax.transAxes,rotation=25)
>>> # ax.text(-63,50,'60$^\circ$W',transform=ccrs.Geodetic(),rotation=25)
>>> for xtick, ytick, label in zip(xticks, yticks, labels):
>>>     ax.text(xtick, ytick, label, transform=ccrs.Geodetic())
>>> x = [180, 180, 0, 0]
>>> y = [50, 90, 90, 50]
>>> ax.plot([-180, 0], [80, 80], ':', transform=ccrs.Geodetic(), color='k', linewidth=0.4)
>>> ax.plot([-90, 90], [80, 80], ':', transform=ccrs.Geodetic(), color='k', linewidth=0.5)
>>> # ax.plot([90,0],[50,50],'-.',transform=ccrs.Geodetic(),color='r', linewidth=6)
>>>
>>> ax.text(11.9333, 78.9166, 'bigstar', transform=ccrs.Geodetic(), size=15, color='r')
>>> plt.show()