>>> from env_helper import info; info()
页面更新时间: 2024-04-10 15:02:35
运行环境:
    Linux发行版本: Debian GNU/Linux 12 (bookworm)
    操作系统内核: Linux-6.1.0-18-amd64-x86_64-with-glibc2.36
    Python版本: 3.11.2
10.2. 开始使用 Cartopy
这一节通过实例演示了Cartopy制图的强大功能。
绘图过程中用到了一些自带数据,需要联网运行。有些时候下载数据还可能会出错。
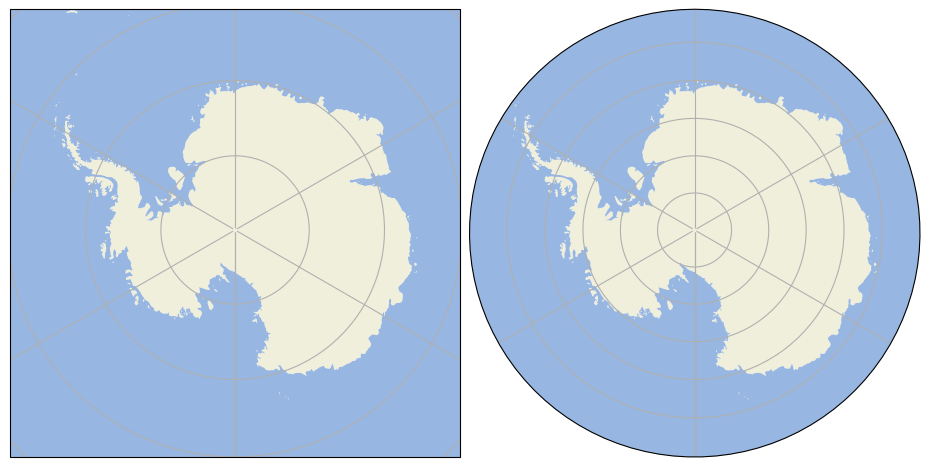
10.2.1. 自定义边界形状
此示例演示如何使用自定义形状几何图形而不是投影的默认边界。 在本例中,我们将边界定义为轴坐标中的圆。这意味着无论地图本身的范围如何,边界始终是一个圆。
在这个实例中需要联网运行,因为会从网络上下载所需要的数据。
>>> %matplotlib inline
>>>
>>> import matplotlib.path as mpath
>>> import matplotlib.pyplot as plt
>>> import numpy as np
>>>
>>> import cartopy.crs as ccrs
>>> import cartopy.feature as cfeature
>>>
>>>
>>> fig = plt.figure(figsize=[10, 5])
>>> ax1 = fig.add_subplot(1, 2, 1, projection=ccrs.SouthPolarStereo())
>>> ax2 = fig.add_subplot(1, 2, 2, projection=ccrs.SouthPolarStereo(),
>>>                       sharex=ax1, sharey=ax1)
>>> fig.subplots_adjust(bottom=0.05, top=0.95,
>>>                     left=0.04, right=0.95, wspace=0.02)
>>>
>>> # Limit the map to -60 degrees latitude and below.
>>> ax1.set_extent([-180, 180, -90, -60], ccrs.PlateCarree())
>>>
>>> ax1.add_feature(cfeature.LAND)
>>> ax1.add_feature(cfeature.OCEAN)
>>>
>>> ax1.gridlines()
>>> ax2.gridlines()
>>>
>>> ax2.add_feature(cfeature.LAND)
>>> ax2.add_feature(cfeature.OCEAN)
>>>
>>> # Compute a circle in axes coordinates, which we can use as a boundary
>>> # for the map. We can pan/zoom as much as we like - the boundary will be
>>> # permanently circular.
>>> theta = np.linspace(0, 2*np.pi, 100)
>>> center, radius = [0.5, 0.5], 0.5
>>> verts = np.vstack([np.sin(theta), np.cos(theta)]).T
>>> circle = mpath.Path(verts * radius + center)
>>>
>>> ax2.set_boundary(circle, transform=ax2.transAxes)
>>>
>>> plt.show()
>>>
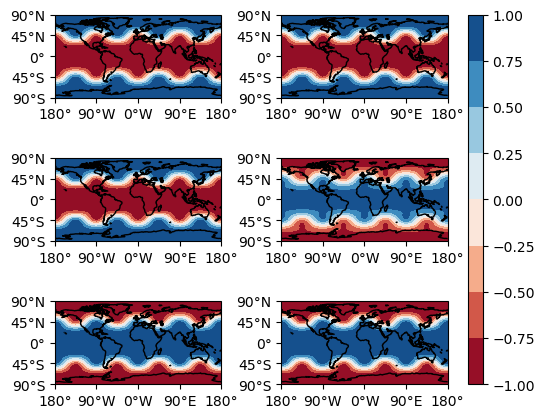
10.2.2. 使用Cartopy和AxesGrid工具包
此示例演示如何将 Cartopy GeoAxes 与来自 mpl_toolkits.axes_grid1 的
AxesGrid 一起使用。 脚本使用Plate
Carree投影构造axes_类kwarg并将其传递给AxesGrid实例。
AxesGrid内置标签关闭,而是使用创建网格线的标准过程。然后绘制一些假数据。
>>> import cartopy.crs as ccrs
>>> from cartopy.mpl.geoaxes import GeoAxes
>>> from cartopy.mpl.ticker import LongitudeFormatter, LatitudeFormatter
>>> import matplotlib.pyplot as plt
>>> from mpl_toolkits.axes_grid1 import AxesGrid
>>> import numpy as np
>>>
>>>
>>> def sample_data_3d(shape):
>>>     """Return `lons`, `lats`, `times` and fake `data`"""
>>>     ntimes, nlats, nlons = shape
>>>     lats = np.linspace(-np.pi / 2, np.pi / 2, nlats)
>>>     lons = np.linspace(0, 2 * np.pi, nlons)
>>>     lons, lats = np.meshgrid(lons, lats)
>>>     wave = 0.75 * (np.sin(2 * lats) ** 8) * np.cos(4 * lons)
>>>     mean = 0.5 * np.cos(2 * lats) * ((np.sin(2 * lats)) ** 2 + 2)
>>>
>>>     lats = np.rad2deg(lats)
>>>     lons = np.rad2deg(lons)
>>>     data = wave + mean
>>>
>>>     times = np.linspace(-1, 1, ntimes)
>>>     new_shape = data.shape + (ntimes, )
>>>     data = np.rollaxis(data.repeat(ntimes).reshape(new_shape), -1)
>>>     data *= times[:, np.newaxis, np.newaxis]
>>>
>>>     return lons, lats, times, data
>>>
>>>
>>>
>>> projection = ccrs.PlateCarree()
>>> axes_class = (GeoAxes,
>>>               dict(map_projection=projection))
>>>
>>> lons, lats, times, data = sample_data_3d((6, 73, 145))
>>>
>>> fig = plt.figure()
>>> axgr = AxesGrid(fig, 111, axes_class=axes_class,
>>>                 nrows_ncols=(3, 2),
>>>                 axes_pad=0.6,
>>>                 cbar_location='right',
>>>                 cbar_mode='single',
>>>                 cbar_pad=0.2,
>>>                 cbar_size='3%',
>>>                 label_mode='')  # note the empty label_mode
>>>
>>> for i, ax in enumerate(axgr):
>>>     ax.coastlines()
>>>     ax.set_xticks(np.linspace(-180, 180, 5), crs=projection)
>>>     ax.set_yticks(np.linspace(-90, 90, 5), crs=projection)
>>>     lon_formatter = LongitudeFormatter(zero_direction_label=True)
>>>     lat_formatter = LatitudeFormatter()
>>>     ax.xaxis.set_major_formatter(lon_formatter)
>>>     ax.yaxis.set_major_formatter(lat_formatter)
>>>
>>>     p = ax.contourf(lons, lats, data[i, ...],
>>>                     transform=projection,
>>>                     cmap='RdBu')
>>>
>>> axgr.cbar_axes[0].colorbar(p)
>>>
>>> plt.show()
/usr/lib/python3/dist-packages/cartopy/mpl/geoaxes.py:406: UserWarning: The map_projection keyword argument is deprecated, use projection to instantiate a GeoAxes instead.
  warnings.warn("The map_projection keyword argument is "
10.2.3. Cartopy标志
还有一些有趣的例子,可以在地图上生成 Cartopy 徽标。