
目录
- 1. 引言
- 2. 使用 GDAL 操作栅格数据
- 3. 使用Rasterio处理栅格数据
- 4. 使用 OGR 库操作矢量数据
- 4.1. 使用OGR模块打开矢量数据
- 4.2. 读取矢量数据
- 4.3. 使用OGR 创建Shapefile
- 4.4. 空间过滤器(Spatial filters)
- 4.5. 空间计算
- 4.6. 使用Fiona
- 5. 空间参考与坐标转换
- 6. 矢量数据的空间分析:使用Shapely
- 7. 使用 SpatiaLite 空间数据库
- 8. 使用 Mapnik 进行地图制图
- 9. 使用Basemap进行地图可视化
- 10. 使用 Cartopy 进行地图绘图
- 11. GeoPandas的用法
- 12. Python下面其他开源GIS库的使用
- 12.1. 使用pyshp读写Shapefile
- 12.2. GeoJSON
- 12.2.1. 定义
- 12.2.2. Geojson
- 12.2.3. GeoJSON对象
- 12.2.4. 几何对象
- 12.2.5. 位置
- 12.2.6. 点(Point)
- 12.2.7. 点集合(MultiPoint)
- 12.2.8. 线(LineString)
- 12.2.9. 线集合(MultiLineString)
- 12.2.10. 多边形(Polygon)
- 12.2.11. 多边形集合(MultiPolygon)
- 12.2.12. 几何集合(GeometryCollection)
- 12.2.13. 要素对象(Feature)
- 12.2.14. 要素集合对象(FeatureCollection)
- 12.2.15. 坐标参考系统对象(coordinate reference system)
- 12.2.16. 命名CRS
- 12.2.17. 链接CRS
- 12.2.18. 链接对象
- 12.2.19. 边界框
- 12.3. Descartes
- 12.4. 使用Folium 进行WebGIS 应用
- 13. [图书说明与周边]
上一个主题
下一个主题
>>> from env_helper import info; info()
页面更新时间: 2022-05-27 12:19:45
运行环境:
Linux发行版本: Debian GNU/Linux bookworm/sid
操作系统内核: Linux-5.16.18-200.fc35.x86_64-x86_64-with-glibc2.33
Python版本: 3.10.4
9.2.5. 球面距离案例
>>> %matplotlib inline
>>> import warnings
>>> warnings.filterwarnings('ignore')
>>> import os
>>> from mpl_toolkits.basemap import Basemap
>>> import matplotlib.pyplot as plt
>>> import numpy as np
代码
>>> my_map = Basemap(projection='merc', lat_0=38, lon_0=89,
>>> resolution='h', area_thresh=0.1,
>>> llcrnrlon=58, llcrnrlat=10,
>>> urcrnrlon=143, urcrnrlat=55)
>>>
>>> my_map.drawcoastlines()
>>> # my_map.drawcountries()
>>> my_map.fillcontinents(color='lightblue')
>>> my_map.drawmapboundary()
>>>
>>>
>>>
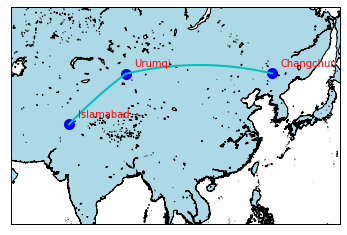
>>> lons = [125.352841, 87.6568, 73.052705]
>>> lats = [43.903566,43.830036, 33.705168]
>>> x, y = my_map(lons, lats)
>>>
>>> labels = ['Changchun', 'Urumqi', 'Islamabad']
>>> x_offsets = [250000] *3
>>> y_offsets = [200000] * 3
>>>
>>>
>>> # x, y = map(lons, lats)
>>>
>>> # my_map.plot(x, y, marker=None,color='r')
>>>
>>> my_map.plot(x, y, 'bo', markersize=10)
>>>
>>> my_map.drawgreatcircle(125.352841, 43.903566, 87.6568, 43.830036, linewidth=2, color='c')
>>> my_map.drawgreatcircle( 87.6568, 43.830036,73.052705, 33.705168, linewidth=2, color='c')
>>>
>>> for label, xpt, ypt, x_offset, y_offset in zip(labels, x, y, x_offsets, y_offsets):
>>> plt.text(xpt + x_offset, ypt + y_offset, label, color='r')
>>>
>>> plt.show()
