>>> from env_helper import info; info()
页面更新时间: 2024-03-04 12:03:56
运行环境:
    Linux发行版本: Debian GNU/Linux 12 (bookworm)
    操作系统内核: Linux-6.1.0-18-amd64-x86_64-with-glibc2.36
    Python版本: 3.11.2
10.4. Cartopy 地图绘图1
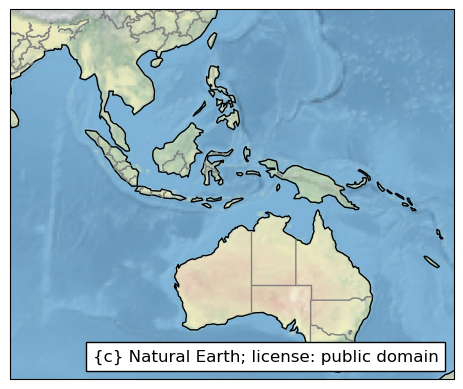
10.4.1. 使用 NatureEarth 数据创建特征
此示例手动实例化 cartopy.feature.NaturalEarthFeature
以访问管理边界(州和省)。
注意,这个例子旨在说明Cartopy不一定知道先验知识的构造自然地球特征的能力。但是,在这种情况下,可以使用预定义的
cartopy.feature.STATES 常量。
>>> import matplotlib.pyplot as plt
>>> import cartopy.crs as ccrs
>>> import cartopy.feature as cfeature
>>> from matplotlib.offsetbox import AnchoredText
>>>
>>>
>>>
>>> fig = plt.figure()
>>> ax = fig.add_subplot(1, 1, 1, projection=ccrs.PlateCarree())
>>> ax.set_extent([80, 170, -45, 30], crs=ccrs.PlateCarree())
>>>
>>> # Put a background image on for nice sea rendering.
>>> ax.stock_img()
>>>
>>> # Create a feature for States/Admin 1 regions at 1:50m from Natural Earth
>>> states_provinces = cfeature.NaturalEarthFeature(
>>>     category='cultural',
>>>     name='admin_1_states_provinces_lines',
>>>     scale='50m',
>>>     facecolor='none')
>>>
>>> SOURCE = 'Natural Earth'
>>> LICENSE = 'public domain'
>>>
>>> ax.add_feature(cfeature.LAND)
>>> ax.add_feature(cfeature.COASTLINE)
>>> ax.add_feature(states_provinces, edgecolor='gray')
>>>
>>> # Add a text annotation for the license information to the
>>> # the bottom right corner.
>>> # 可以用数学表达式。
>>>
>>> text = AnchoredText('{{c}} {}; license: {}'
>>>                     ''.format(SOURCE, LICENSE),
>>>                     loc=4, prop={'size': 12}, frameon=True)
>>> ax.add_artist(text)
>>>
>>> plt.show()
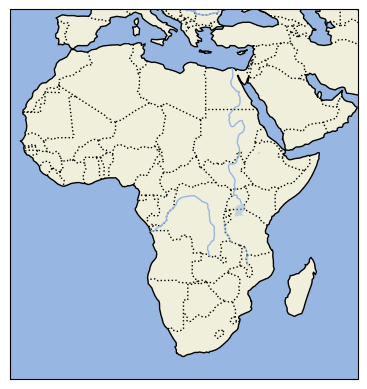
10.4.2. 特征
在cartopy中发现的一些内置自然地球特征的演示。
>>> import cartopy.crs as ccrs
>>> import cartopy.feature as cfeature
>>>
>>>
>>> fig = plt.figure()
>>> ax = fig.add_subplot(1, 1, 1, projection=ccrs.PlateCarree())
>>> ax.set_extent([-20, 60, -40, 45], crs=ccrs.PlateCarree())
>>>
>>> ax.add_feature(cfeature.LAND)
>>> ax.add_feature(cfeature.OCEAN)
>>> ax.add_feature(cfeature.COASTLINE)
>>> ax.add_feature(cfeature.BORDERS, linestyle=':')
>>> ax.add_feature(cfeature.LAKES, alpha=0.5)
>>> ax.add_feature(cfeature.RIVERS)
>>>
>>> plt.show()
>>>
10.4.3. 夜色特征
绘制给定日期时间没有阳光的多边形。
>>> import datetime
>>> import cartopy.crs as ccrs
>>> from cartopy.feature.nightshade import Nightshade
>>>
>>>
>>> fig = plt.figure(figsize=(10, 5))
>>> ax = fig.add_subplot(1, 1, 1, projection=ccrs.PlateCarree())
>>>
>>> date = datetime.datetime(1999, 12, 31, 12)
>>>
>>> ax.set_title('Night time shading for {}'.format(date))
>>> ax.stock_img()
>>> ax.add_feature(Nightshade(date, alpha=0.2))
>>> plt.show()

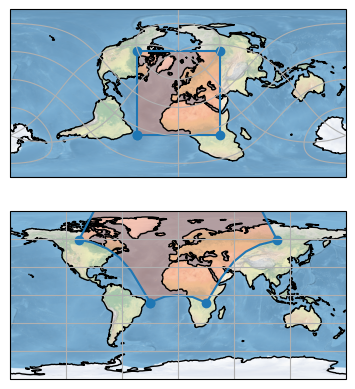
10.4.4. 旋转极盒
在旋转极坐标系中定义长方体时,长方体扭曲方式的演示。 尝试将box_top更改为44、46和75,以查看将极点包含在多边形中所产生的效果。
>>>
>>>
>>> import cartopy.crs as ccrs
>>>
>>>
>>> rotated_pole = ccrs.RotatedPole(pole_latitude=45, pole_longitude=180)
>>>
>>> box_top = 45
>>> x, y = [-44, -44, 45, 45, -44], [-45, box_top, box_top, -45, -45]
>>>
>>> fig = plt.figure()
>>>
>>> ax = fig.add_subplot(2, 1, 1, projection=rotated_pole)
>>> ax.stock_img()
>>> ax.coastlines()
>>> ax.plot(x, y, marker='o', transform=rotated_pole)
>>> ax.fill(x, y, color='coral', transform=rotated_pole, alpha=0.4)
>>> ax.gridlines()
>>>
>>> ax = fig.add_subplot(2, 1, 2, projection=ccrs.PlateCarree())
>>> ax.stock_img()
>>> ax.coastlines()
>>> ax.plot(x, y, marker='o', transform=rotated_pole)
>>> ax.fill(x, y, transform=rotated_pole, color='coral', alpha=0.4)
>>> ax.gridlines()
>>>
>>> plt.show()
>>>
>>>