
使用世界坐标绘制绘图(WCSAxes)#
WCSAXS是一个用于绘制天文数据曲线图的框架 Matplotlib 。它以前是作为独立的包分发的 (wcsaxes ),但现在包含在 astropy.visualization 。
入门#
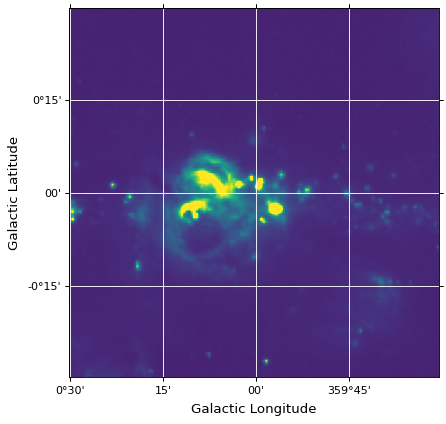
以下是使用WCSAxes包打印图像的一个非常简单的示例:
import matplotlib.pyplot as plt

from astropy.wcs import WCS
from astropy.io import fits
from astropy.utils.data import get_pkg_data_filename

filename = get_pkg_data_filename('galactic_center/gc_msx_e.fits')

hdu = fits.open(filename)[0]
wcs = WCS(hdu.header)

plt.subplot(projection=wcs)
plt.imshow(hdu.data, vmin=-2.e-5, vmax=2.e-4, origin='lower')
plt.grid(color='white', ls='solid')
plt.xlabel('Galactic Longitude')
plt.ylabel('Galactic Latitude')
此示例使用 matplotlib.pyplot 接口,但WCSAxes可以与任何其他使用Matplotlib的方式一起使用(在 使用世界坐标初始化轴 ). 例如,使用部分面向对象接口,可以执行以下操作:
ax = plt.subplot(projection=wcs)
ax.imshow(hdu.data, vmin=-2.e-5, vmax=2.e-4, origin='lower')
ax.grid(color='white', ls='solid')
ax.set_xlabel('Galactic Longitude')
ax.set_ylabel('Galactic Latitude')
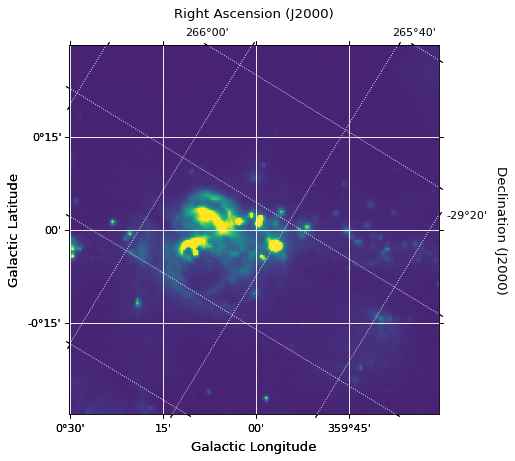
但是,需要axes对象来访问WCSAxes的一些更高级的功能。这种用法的一个例子是:
ax = plt.subplot(projection=wcs, label='overlays')

ax.imshow(hdu.data, vmin=-2.e-5, vmax=2.e-4, origin='lower')

ax.coords.grid(True, color='white', ls='solid')
ax.coords[0].set_axislabel('Galactic Longitude')
ax.coords[1].set_axislabel('Galactic Latitude')

overlay = ax.get_coords_overlay('fk5')
overlay.grid(color='white', ls='dotted')
overlay[0].set_axislabel('Right Ascension (J2000)')
overlay[1].set_axislabel('Declination (J2000)')
在本文档的其余部分中,我们假设您保留了对axis对象的引用,我们将其称为 ax . 但是,我们也注意到什么时候可以直接使用pyplot接口来完成一些事情。
WCSAxes支持许多高级打印选项,包括控制在哪些轴上显示哪个坐标的标签的能力,覆盖来自不同坐标系数据的等高线,覆盖不同坐标系的网格,处理从比绘图尺寸更大的数据中绘制切片的能力,以及定义自定义(非矩形)框架。
使用WCSAxes#
参考/API#
astropy.visualization.wcsaxes公司包裹#
功能#
|
显示梁的形状和大小。 |
|
添加比例尺。 |
Classes#
|
的配置参数 |
|
类来控制 |
|
表示坐标系的坐标辅助对象的容器。 |
|
创建一个表示经纬度四边形的面片。 |
|
创建一个表示球面圆的面片-也就是说,一个由所有点组成的圆,这些点都在球体中心坐标的某个角度内。 |
|
可用于显示WCS世界坐标的main Axis类。 |
|
WCSAX的子类。 |
astropy.visualization.wcsaxes公司.框架模块#
Classes#
|
经典的长方形框架。 |
|
轴线的单面。 |
|
框架的基类,它是 |
|
经典的长方形框架。 |
|
椭圆框。 |