
使用世界坐标初始化轴#
基本初始化#
用 WCSAxes, we first read in the data using astropy.io.fits 并解析WCS信息。在本例中,我们将使用来自http://data.astropy.org服务器(在 get_pkg_data_filename() 函数下载文件并返回文件名):
from astropy.wcs import WCS
from astropy.io import fits
from astropy.utils.data import get_pkg_data_filename

filename = get_pkg_data_filename('galactic_center/gc_msx_e.fits')

hdu = fits.open(filename)[0]
wcs = WCS(hdu.header)
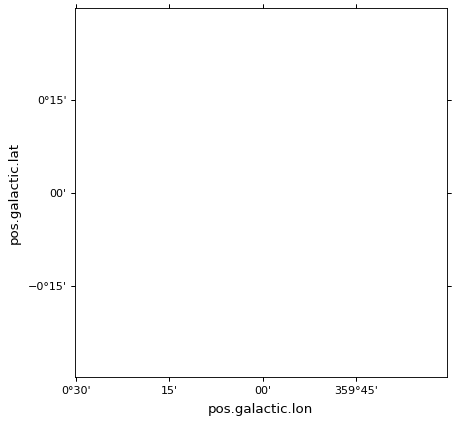
然后我们使用Matplotlib创建一个图形,并使用 WCS 上面创建的对象。以下示例显示如何使用Matplotlib“pyplot”接口执行此操作,同时保留对axis对象的引用:
import matplotlib.pyplot as plt
ax = plt.subplot(projection=wcs)

这个 ax 对象是 WCSAxes 班级。注意,如果没有指定WCS转换,转换将默认为identity,这意味着世界坐标将与像素坐标匹配。
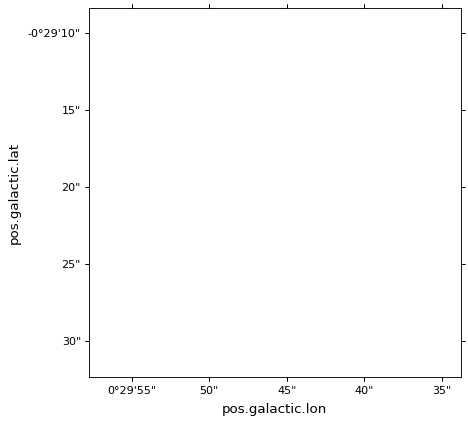
对于标准matplotlib轴,显示的视场在两个方向上都是0到1,以像素坐标表示。一旦您显示图像(请参见 绘制图像和等高线 ),将调整限制,但如果需要,也可以手动调整限制。使用与普通Matplotlib绘图相同的函数/方法调整限制:
ax.set_xlim(-0.5, hdu.data.shape[1] - 0.5)
ax.set_ylim(-0.5, hdu.data.shape[0] - 0.5)
备注
如果使用pyplot接口,还可以替换 ax.set_xlim 和 ax.set_ylim 通过 plt.xlim 和 plt.ylim .
替代方法#
在Matplotlib中,实际上有几种方法可以初始化 WCSAxes .
如上所示,最简单的方法是利用 WCS 把这个传给 plt.subplot . 如果通常使用Matplotlib的(部分)面向对象接口,也可以执行以下操作:
fig = plt.figure()
ax = fig.add_subplot(1, 1, 1, projection=wcs)
请注意,这也适用于 add_axes() 和 axes() ,例如:
ax = fig.add_axes([0.1, 0.1, 0.8, 0.8], projection=wcs)
或:
plt.axes([0.1, 0.1, 0.8, 0.8], projection=wcs)
传递给的任何其他参数 add_subplot() , add_axes() , subplot() 或 axes() ,如 slices 或 frame_class ,将传递给 WCSAxes 班级。
直接初始化WCSAxes#
作为上述初始化方法的替代方法 WCSAxes ,也可以实例化 WCSAxes 直接添加到图中:
from astropy.wcs import WCS
from astropy.visualization.wcsaxes import WCSAxes
import matplotlib.pyplot as plt

wcs = WCS(...)

fig = plt.figure()
ax = WCSAxes(fig, [0.1, 0.1, 0.8, 0.8], wcs=wcs)
fig.add_axes(ax)  # note that the axes have to be explicitly added to the figure