

在Matplotlib中绘制Astropy对象#
绘制数量#
Quantity 可以使用matplotlib方便地绘制对象。此功能需要明确打开:
>>> from astropy.visualization import quantity_support
>>> quantity_support()
<astropy.visualization.units.MplQuantityConverter ...>
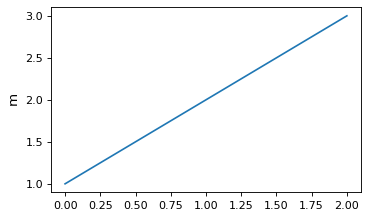
然后 Quantity 对象可以传递给matplotlib绘图函数。轴标签会自动以数量为单位进行标记:
from astropy import units as u
from astropy.visualization import quantity_support
quantity_support()
from matplotlib import pyplot as plt
fig, ax = plt.subplots(figsize=(5, 3))
ax.plot([1, 2, 3] * u.m)
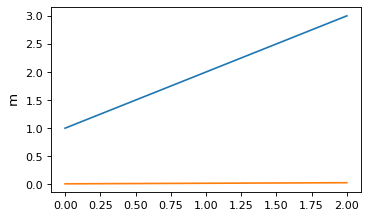
数量会自动转换为在特定轴上设置的第一个单位,因此在以下情况下,y轴将保持在 m 即使第二行被放弃了 cm :
ax.plot([1, 2, 3] * u.cm)

用不兼容的单位绘制数量将引发异常。例如呼叫 ax.plot([1, 2, 3] * u.kg) (mass单位)在上面显示长度单位的图上进行叠加。
为了确保单元支持在之后关闭,可以使用 quantity_support 用一个 with 声明:
with quantity_support():
    ax.plot([1, 2, 3] * u.m)
打印时间#
Matplotlib本身提供了一种在一个或两个轴上绘制日期和时间的机制,如中所述 Date tick labels 。要利用这一点,您可以使用 plot_date 的属性 Time 以获取Matplotlib使用的时间系统中的值。
但是,在许多情况下,您可能希望对刻度标签使用的精确比例和格式有更多的控制,在这种情况下,您可以使用 time_support 功能。此功能需要显式打开:
>>> from astropy.visualization import time_support
>>> time_support()
<astropy.visualization.units.MplTimeConverter ...>
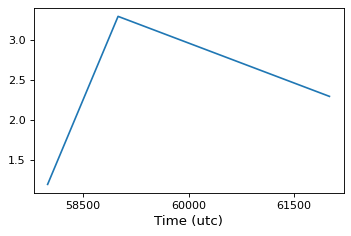
一旦启用此功能, Time 对象可以传递给matplotlib绘图函数。然后,使用格式化的时间自动标注轴标签 Time 班级:
from matplotlib import pyplot as plt
from astropy.time import Time
from astropy.visualization import time_support

time_support()

fig, ax = plt.subplots(figsize=(5, 3))
ax.plot(Time([58000, 59000, 62000], format='mjd'), [1.2, 3.3, 2.3])
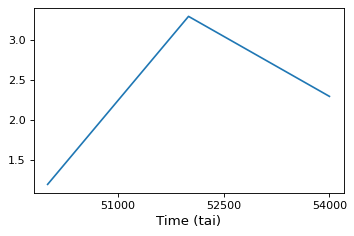
默认情况下,用于打印的格式和比例是从Matplotlib第一次遇到特定轴实例时开始的。也可以通过将参数传递给 time_support :
time_support(format='mjd', scale='tai')
fig, ax = plt.subplots(figsize=(5, 3))
ax.plot(Time([50000, 52000, 54000], format='mjd'), [1.2, 3.3, 2.3])
要确保以后关闭对打印时间的支持,可以使用 time_support 作为上下文管理器:
with time_support(format='mjd', scale='tai'):
    fig, ax = plt.subplots(figsize=(5, 3))
    ax.plot(Time([50000, 52000, 54000], format='mjd'))