
使用自定义框架#
默认情况下, WCSAxes 将为绘图使用矩形框,但可以更改此框以提供任何自定义框。下面的示例演示如何使用内置 EllipticalFrame 类,它是一个椭圆,扩展到与内置矩形框架相同的限制:
from astropy.wcs import WCS
from astropy.io import fits
from astropy.utils.data import get_pkg_data_filename
from astropy.visualization.wcsaxes.frame import EllipticalFrame
import matplotlib.pyplot as plt

filename = get_pkg_data_filename('galactic_center/gc_msx_e.fits')
hdu = fits.open(filename)[0]
wcs = WCS(hdu.header)

fig, ax = plt.subplots(subplot_kw=dict(projection=wcs, frame_class=EllipticalFrame))

ax.coords.grid(color='white')

im = ax.imshow(hdu.data, vmin=-2.e-5, vmax=2.e-4, origin='lower')

# Clip the image to the frame
im.set_clip_path(ax.coords.frame.patch)
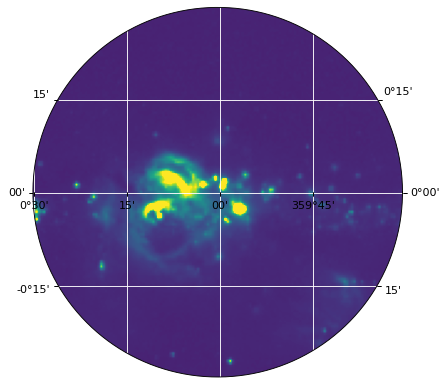
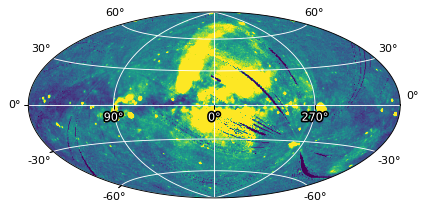
这个 EllipticalFrame 类对于所有天空图特别有用,例如Aitoff投影:
from astropy.wcs import WCS
from astropy.io import fits
from astropy.utils.data import get_pkg_data_filename
from astropy.visualization.wcsaxes.frame import EllipticalFrame
from matplotlib import patheffects
import matplotlib.pyplot as plt

filename = get_pkg_data_filename('allsky/allsky_rosat.fits')
hdu = fits.open(filename)[0]
wcs = WCS(hdu.header)

fig, ax = plt.subplots(subplot_kw=dict(projection=wcs, frame_class=EllipticalFrame))

path_effects=[patheffects.withStroke(linewidth=3, foreground='black')]
ax.coords.grid(color='white')
ax.coords['glon'].set_ticklabel(color='white', path_effects=path_effects)

im = ax.imshow(hdu.data, vmin=0., vmax=300., origin='lower')

# Clip the image to the frame
im.set_clip_path(ax.coords.frame.patch)
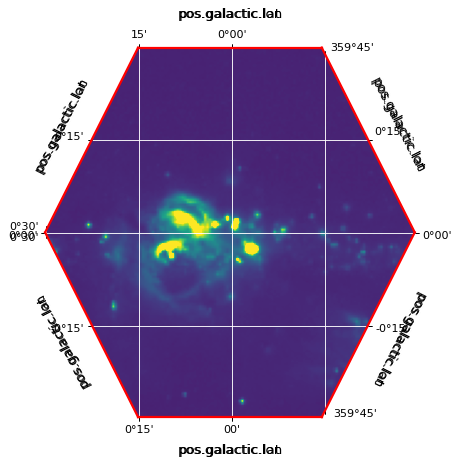
但是,您也可以编写自己的框架类。这个想法是设置任意数量的连接脊椎来定义框架。可以将帧定义为脊椎,但如果将其定义为多个脊椎,则可以控制记号标签和记号应显示在哪个脊椎上。
以下示例显示如何定义六边形框架:
import numpy as np
from astropy.visualization.wcsaxes.frame import BaseFrame

class HexagonalFrame(BaseFrame):

    spine_names = 'abcdef'

    def update_spines(self):

        xmin, xmax = self.parent_axes.get_xlim()
        ymin, ymax = self.parent_axes.get_ylim()

        ymid = 0.5 * (ymin + ymax)
        xmid1 = (xmin + xmax) / 4.
        xmid2 = (xmin + xmax) * 3. / 4.

        self['a'].data = np.array(([xmid1, ymin], [xmid2, ymin]))
        self['b'].data = np.array(([xmid2, ymin], [xmax, ymid]))
        self['c'].data = np.array(([xmax, ymid], [xmid2, ymax]))
        self['d'].data = np.array(([xmid2, ymax], [xmid1, ymax]))
        self['e'].data = np.array(([xmid1, ymax], [xmin, ymid]))
        self['f'].data = np.array(([xmin, ymid], [xmid1, ymin]))
然后我们可以使用:
from astropy.wcs import WCS
from astropy.io import fits
from astropy.utils.data import get_pkg_data_filename
import matplotlib.pyplot as plt

filename = get_pkg_data_filename('galactic_center/gc_msx_e.fits')
hdu = fits.open(filename)[0]
wcs = WCS(hdu.header)

fig, ax = plt.subplots(subplot_kw=dict(projection=wcs, frame_class=HexagonalFrame))

ax.coords.grid(color='white')

im = ax.imshow(hdu.data, vmin=-2.e-5, vmax=2.e-4, origin='lower')

# Clip the image to the frame
im.set_clip_path(ax.coords.frame.patch)

框架属性#
边框的颜色和线宽也可以通过
ax.coords.frame.set_color('red')
ax.coords.frame.set_linewidth(2)