

过度标记和艺术家#
这个班级 WCSAxes 提供了两种方便的方法: plot_coord() , scatter_coord()
习惯于分别绘制和散布 SkyCoord 或 BaseCoordinateFrame 轴上的坐标。这个 transform 将基于坐标创建关键字参数,在此处指定它将引发 TypeError 。
对于下一页中的示例,我们从中介绍的示例开始 使用世界坐标初始化轴 .
像素坐标#
除了处理记号、记号标签和网格线之外 WCSAxes 类的行为类似于普通的Matplotlib Axes 实例和方法,例如 imshow() , contour() , plot() , scatter() ,以此类推,并在中绘制数据 像素坐标 默认情况下。
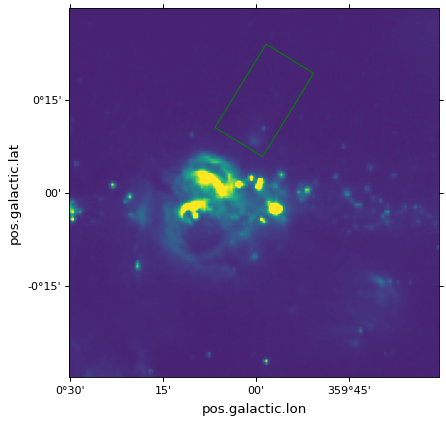
在以下示例中,散点标记和矩形将以像素坐标绘制:
# The following line makes it so that the zoom level no longer changes,
# otherwise Matplotlib has a tendency to zoom out when adding overlays.
ax.set_autoscale_on(False)

# Add a rectangle with bottom left corner at pixel position (30, 50) with a
# width and height of 60 and 50 pixels respectively.
from matplotlib.patches import Rectangle
r = Rectangle((30., 50.), 60., 50., edgecolor='yellow', facecolor='none')
ax.add_patch(r)

# Add three markers at (40, 30), (100, 130), and (130, 60). The facecolor is
# a transparent white (0.5 is the alpha value).
ax.scatter([40, 100, 130], [30, 130, 60], s=100, edgecolor='white', facecolor=(1, 1, 1, 0.5))

世界坐标#
所有这些Matplotlib命令都允许 transform= 参数,它将在将输入传递到Matplotlib并打印之前将其从世界坐标转换为像素坐标。例如::
ax.scatter(..., transform=...)
将获取传递给 scatter() 并将使用传递给 transform= ,以获得最终像素坐标。
的 WCSAxes 类别包括 get_transform() 该方法可用于获取适当的转换对象,以从各种世界坐标系转换到Matplotlib所需的最终显示坐标系。的 get_transform() 方法可以采用许多不同的输入,这些输入将在本节和后续部分中进行描述。该方法的两个最简单的输入是 'world' 和 'pixel' .
例如,如果您的WCS定义了一个图像,其中坐标系由以度为单位的角度和以纳米为单位的波长组成,则可以执行以下操作:
ax.scatter([34], [3.2], transform=ax.get_transform('world'))
在(34度,3.2米)处绘制标记。
使用 ax.get_transform('pixel') 相当于根本不使用任何转换(然后事情的行为如 Pixel coordinates 部分)。
天体坐标#
对于WCS表示天体坐标的特殊情况,可以将许多其他输入传递给 get_transform() . 这些是:
'fk4':B1950 FK4赤道坐标'fk5':J2000 FK5赤道坐标'icrs':ICRS赤道坐标'galactic':银河系坐标
此外,任何有效的 astropy.coordinates 坐标框可以传递。
例如,可以使用以下方法添加在FK5系统中定义位置的标记:
ax.scatter(266.78238, -28.769255, transform=ax.get_transform('fk5'), s=300,
           edgecolor='white', facecolor='none')

如果是 scatter() 和 plot() ,标记中心的位置被变换,但标记本身被绘制在图像的参照系中,这意味着它们看起来不会失真。
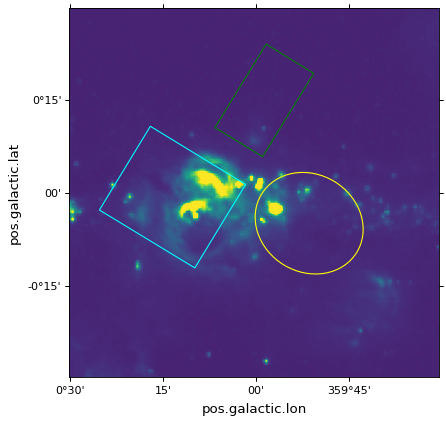
面片/形状/线条#
转换也可以传递给Astropy或Matplotlib补丁。例如,我们可以使用 get_transform() 上述在FK5赤道坐标系下绘制四边形的方法:
from astropy import units as u
from astropy.visualization.wcsaxes import Quadrangle

r = Quadrangle((266.0, -28.9)*u.deg, 0.3*u.deg, 0.15*u.deg,
               edgecolor='green', facecolor='none',
               transform=ax.get_transform('fk5'))
ax.add_patch(r)
在这种情况下,四边形将以FK5 J2000坐标(266deg,-28.9 deg)绘制。见 Quadrangles 有关的详细信息,请参阅 Quadrangle .
然而,它是 非常重要 要注意的是,虽然高度确实是0.15度,但宽度在天空中并不严格表示0.3度,而是在经度上以0.3度为间隔(这取决于纬度,将代表天空上不同的角度)。换句话说,如果将宽度和高度设置为相同的值,则生成的多边形将不是正方形。同样适用于 Circle 面片,实际上不会生成圆:
from matplotlib.patches import Circle

r = Quadrangle((266.4, -28.9)*u.deg, 0.3*u.deg, 0.3*u.deg,
               edgecolor='cyan', facecolor='none',
               transform=ax.get_transform('fk5'))
ax.add_patch(r)

c = Circle((266.4, -29.1), 0.15, edgecolor='yellow', facecolor='none',
           transform=ax.get_transform('fk5'))
ax.add_patch(c)

重要
如果您感兴趣的是简单地围绕源绘制圆圈以突出显示它们,那么我们建议使用 scatter() ,因为对于圆形标记(默认),圆将被保证是绘图中的圆,并且仅转换中心的位置。
要绘制“真实”球面圆,请参见 Spherical patches 部分。
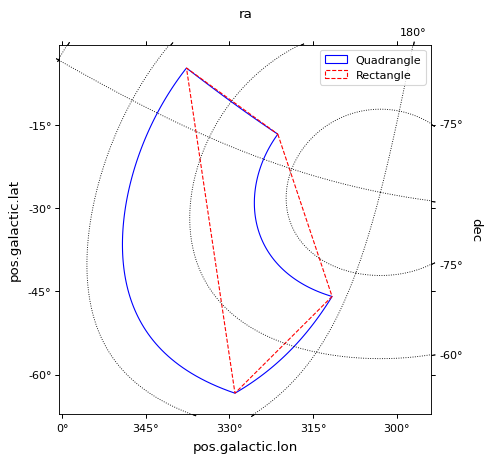
四合院#
Quadrangle 是绘制四边形的建议修补程序,而不是Matplotlib Rectangle . 四边形的边缘位于经度恒定的两条直线和纬度恒定的两条直线上(或者是相关坐标系中的等效组件名称,例如赤经和赤纬)。边缘 Quadrangle 将渲染为曲线(如果适用于WCS转换)。相反, Rectangle 总是有直边。下面比较两种绘制四边形的面片类型 ICRS 坐标 Galactic 坐标轴:
from matplotlib.patches import Rectangle

# Set the Galactic axes such that the plot includes the ICRS south pole
fig, ax = plt.subplots(subplot_kw=dict(projection=wcs))
ax.set_xlim(0, 10000)
ax.set_ylim(-10000, 0)

# Overlay the ICRS coordinate grid
overlay = ax.get_coords_overlay('icrs')
overlay.grid(color='black', ls='dotted')

# Add a quadrangle patch (100 degrees by 20 degrees)
q = Quadrangle((255, -70)*u.deg, 100*u.deg, 20*u.deg,
               label='Quadrangle', edgecolor='blue', facecolor='none',
               transform=ax.get_transform('icrs'))
ax.add_patch(q)

# Add a rectangle patch (100 degrees by 20 degrees)
r = Rectangle((255, -70), 100, 20,
              label='Rectangle', edgecolor='red', facecolor='none', linestyle='--',
              transform=ax.get_transform('icrs'))
ax.add_patch(r)

ax.legend(loc='upper right')
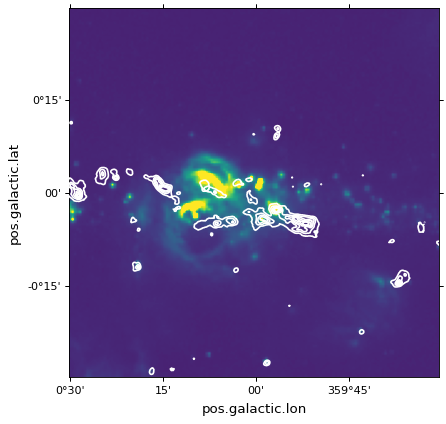
等高线#
使用 get_transform() 方法。对于轮廓, get_transform() 应给出图像的WCS,以绘制轮廓:
filename = get_pkg_data_filename('galactic_center/gc_bolocam_gps.fits')
hdu = fits.open(filename)[0]
ax.contour(hdu.data, transform=ax.get_transform(WCS(hdu.header)),
           levels=[1,2,3,4,5,6], colors='white')

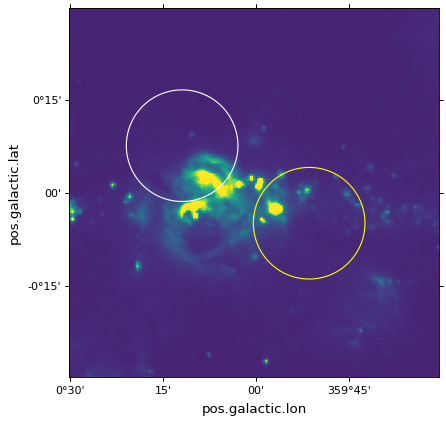
球形贴片#
如果您正在绘制天文图像的绘图,并且希望绘制一个表示经度/纬度的某个角度内的面积的圆,则 Circle 面片是不合适的,因为它会导致扭曲的形状(因为经度与天空上的角度不同)。对于此用例,您可以改用 SphericalCircle ,它需要一个元组 Quantity 或者是 SkyCoord 对象作为输入,而一个 Quantity 作为半径:
from astropy import units as u
from astropy.coordinates import SkyCoord
from astropy.visualization.wcsaxes import SphericalCircle


r = SphericalCircle((266.4 * u.deg, -29.1 * u.deg), 0.15 * u.degree,
                     edgecolor='yellow', facecolor='none',
                     transform=ax.get_transform('fk5'))

ax.add_patch(r)

#The following lines show the usage of a SkyCoord object as the input.
skycoord_object = SkyCoord(266.4 * u.deg, -28.7 * u.deg)
s = SphericalCircle(skycoord_object, 0.15 * u.degree,
                    edgecolor='white', facecolor='none',
                    transform=ax.get_transform('fk5'))

ax.add_patch(s)

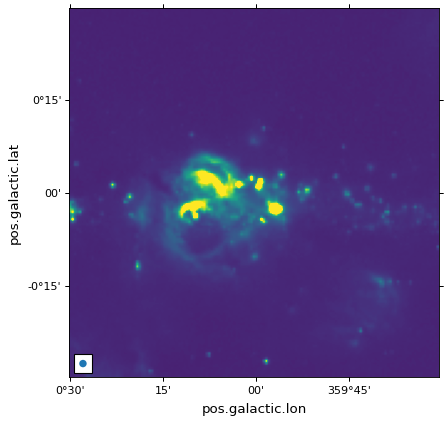
梁形状和比例尺#
在天文图像上添加表示光束形状的椭圆可以使用 add_beam() 功能:
from astropy import units as u
from astropy.visualization.wcsaxes import add_beam, add_scalebar

add_beam(ax, major=1.2 * u.arcmin, minor=1.2 * u.arcmin, angle=0, frame=True)
若要添加显示物理比例的线段,可以使用 add_scalebar() 功能:
# Compute the angle corresponding to 10 pc at the distance of the galactic center
gc_distance = 8.2 * u.kpc
scalebar_length = 10 * u.pc
scalebar_angle = (scalebar_length / gc_distance).to(
    u.deg, equivalencies=u.dimensionless_angles()
)

# Add a scale bar
add_scalebar(ax, scalebar_angle, label="10 pc", color="white")
