注解
点击 here 下载完整的示例代码
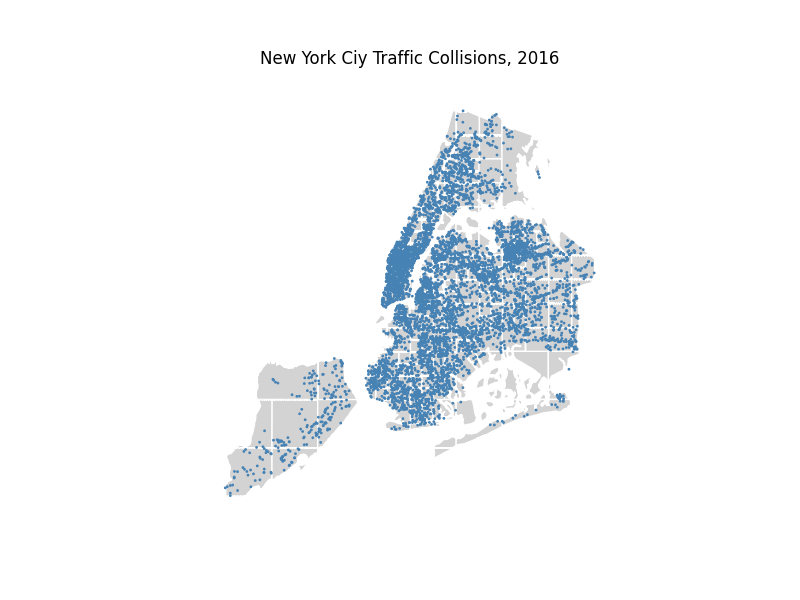
纽约交通碰撞四叉树
这个例子描绘了纽约市的交通碰撞。叠加 pointplot 在一 quadtree 这样就可以同时在两个视觉通道(位置和纹理)上传递信息。
出:
/tmp/vpy/lib/python3.8/site-packages/geopandas/geoseries.py:371: UserWarning: GeoSeries.isna() previously returned True for both missing (None) and empty geometries. Now, it only returns True for missing values. Since the calling GeoSeries contains empty geometries, the result has changed compared to previous versions of GeoPandas.
Given a GeoSeries 's', you can use 's.is_empty | s.isna()' to get back the old behaviour.

To further ignore this warning, you can do:
import warnings; warnings.filterwarnings('ignore', 'GeoSeries.isna', UserWarning)
  return self.isna()
import geopandas as gpd
import geoplot as gplt
import geoplot.crs as gcrs
import matplotlib.pyplot as plt

nyc_boroughs = gpd.read_file(gplt.datasets.get_path('nyc_boroughs'))
collisions = gpd.read_file(gplt.datasets.get_path('nyc_collision_factors'))

ax = gplt.quadtree(
    collisions, nmax=1,
    projection=gcrs.AlbersEqualArea(), clip=nyc_boroughs,
    facecolor='lightgray', edgecolor='white', zorder=0
)
gplt.pointplot(collisions, s=1, ax=ax)

plt.title("New York Ciy Traffic Collisions, 2016")
plt.savefig("nyc-collisions-quadtree.png", bbox_inches='tight', pad_inches=0)
脚本的总运行时间: (6分13.189秒)