注解
点击 here 下载完整的示例代码
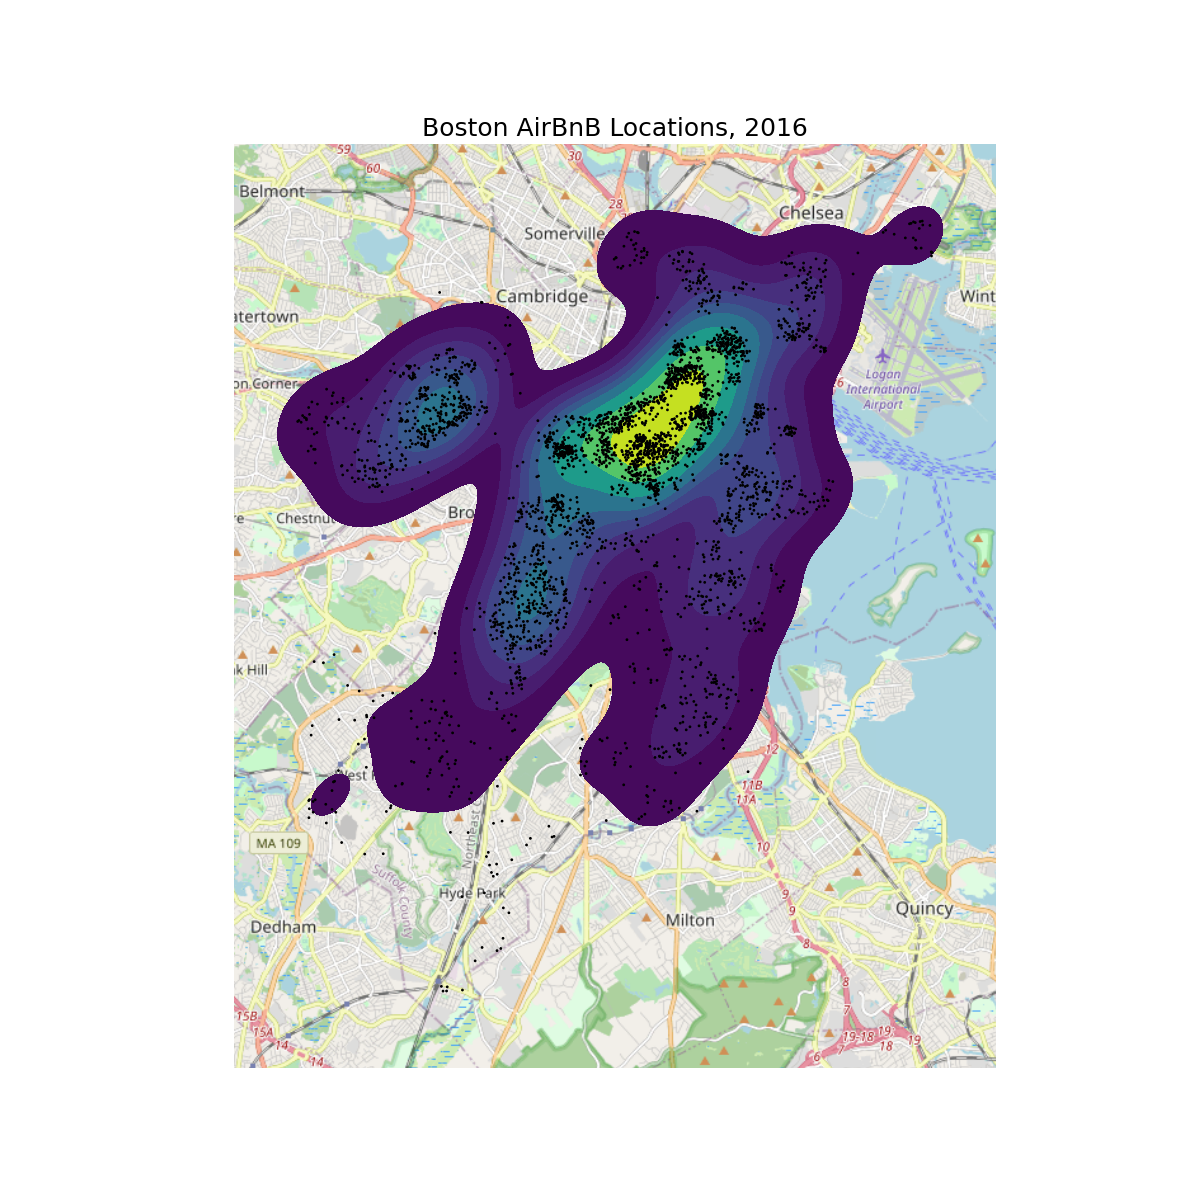
波士顿AirBnB位置的KDEPlot
此示例演示了 kdeplot 和 pointplot 到波士顿AirBnB位置的数据集。结果使用nifty输出到webmap mplleaflet 类库。我们只采样了1000个点,它捕捉到了整体趋势,而没有压倒渲染器。
Click here to see this plot as an interactive webmap.
出:
/tmp/vpy/lib/python3.8/site-packages/seaborn/_decorators.py:36: FutureWarning: Pass the following variable as a keyword arg: y. From version 0.12, the only valid positional argument will be `data`, and passing other arguments without an explicit keyword will result in an error or misinterpretation.
  warnings.warn(
/tmp/vpy/lib/python3.8/site-packages/seaborn/distributions.py:1676: UserWarning: `shade_lowest` is now deprecated in favor of `thresh`. Setting `thresh=0.05`, but please update your code.
  warnings.warn(msg, UserWarning)
import geopandas as gpd
import geoplot as gplt
import geoplot.crs as gcrs
import matplotlib.pyplot as plt
import mplleaflet

boston_airbnb_listings = gpd.read_file(gplt.datasets.get_path('boston_airbnb_listings'))

ax = gplt.kdeplot(
    boston_airbnb_listings, cmap='viridis', projection=gcrs.WebMercator(), figsize=(12, 12),
    shade=True
)
gplt.pointplot(boston_airbnb_listings, s=1, color='black', ax=ax)
gplt.webmap(boston_airbnb_listings, ax=ax)
plt.title('Boston AirBnB Locations, 2016', fontsize=18)

fig = plt.gcf()
plt.savefig("boston-airbnb-kde.png", bbox_inches='tight', pad_inches=0.1)
# mplleaflet.show(fig)
脚本的总运行时间: (106分21.334秒)