注解
点击 here 下载完整的示例代码
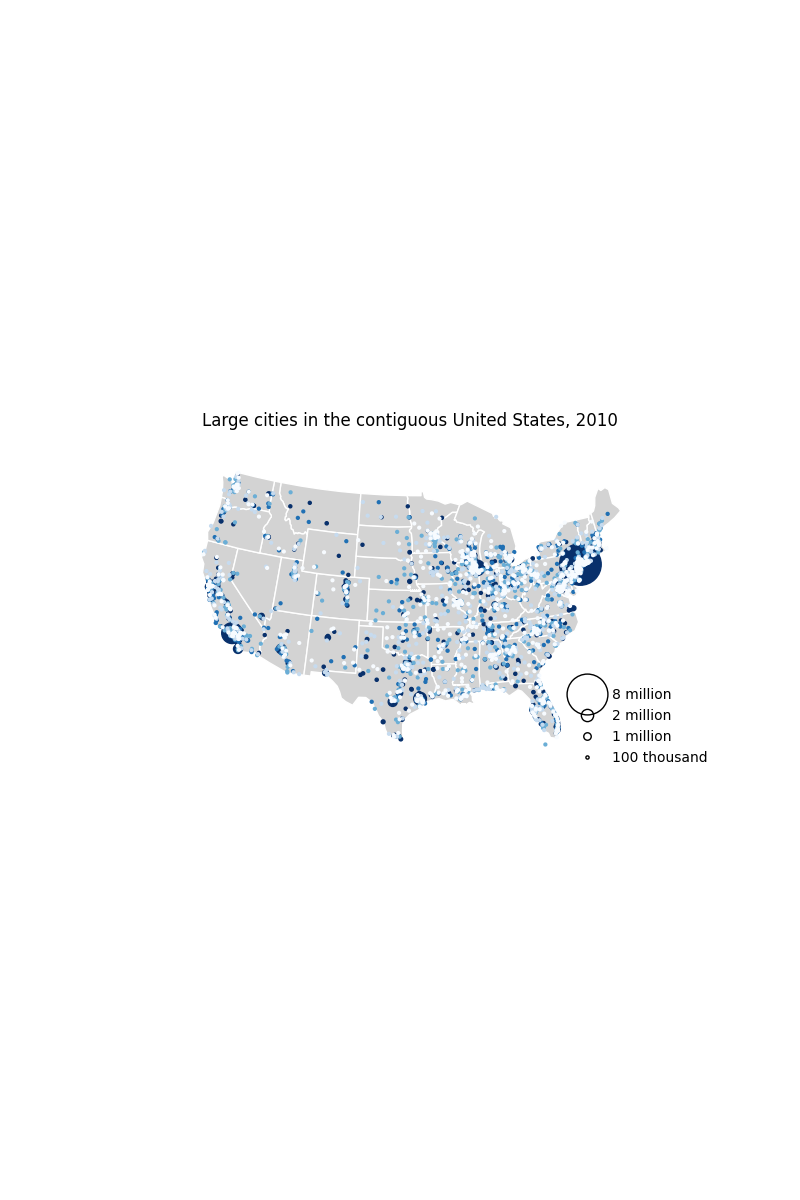
美国城市人口点图
本例摘自《用户指南》,以人口为单位绘制了毗邻美国的城市。它演示了中可用的一些样式选项 geoplot .
import geopandas as gpd
import geoplot as gplt
import geoplot.crs as gcrs
import matplotlib.pyplot as plt
import mapclassify as mc

continental_usa_cities = gpd.read_file(gplt.datasets.get_path('usa_cities'))
continental_usa_cities = continental_usa_cities.query('STATE not in ["AK", "HI", "PR"]')
contiguous_usa = gpd.read_file(gplt.datasets.get_path('contiguous_usa'))
scheme = mc.Quantiles(continental_usa_cities['POP_2010'], k=5)

ax = gplt.polyplot(
    contiguous_usa,
    zorder=-1,
    linewidth=1,
    projection=gcrs.AlbersEqualArea(),
    edgecolor='white',
    facecolor='lightgray',
    figsize=(8, 12)
)
gplt.pointplot(
    continental_usa_cities,
    scale='POP_2010',
    limits=(2, 30),
    hue='POP_2010',
    cmap='Blues',
    scheme=scheme,
    legend=True,
    legend_var='scale',
    legend_values=[8000000, 2000000, 1000000, 100000],
    legend_labels=['8 million', '2 million', '1 million', '100 thousand'],
    legend_kwargs={'frameon': False, 'loc': 'lower right'},
    ax=ax
)


plt.title("Large cities in the contiguous United States, 2010")
plt.savefig("largest-cities-usa.png", bbox_inches='tight', pad_inches=0.1)
脚本的总运行时间: (0分4.937秒)