使用投影
本教程的这一部分讨论 map projections . 如果你不知道什么是投影,或者你想了解更多关于投影的工作原理 geoplot ,此页是给你的!
我建议在本教程中使用 Binder .
投影与非投影
import geopandas as gpd
import geoplot as gplt
%matplotlib inline
# load the example data
contiguous_usa = gpd.read_file(gplt.datasets.get_path('contiguous_usa'))
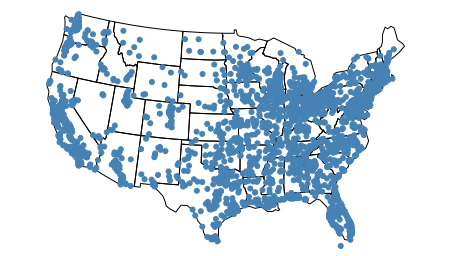
gplt.polyplot(contiguous_usa)
<matplotlib.axes._subplots.AxesSubplot at 0x11a914208>
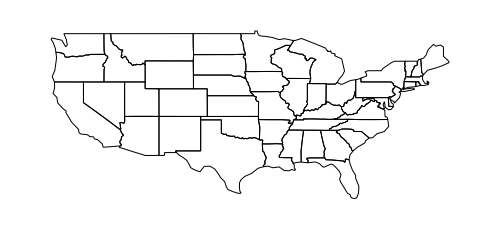
这张地图是一个未投影图的例子:它再现了我们的坐标,就好像它们在一个平面上。但是请记住,地球不是一个平面,而是一个球体。这不是你在任何地方看到的美国地图,因为它严重扭曲了这两个世界 two criteria 大多数预测的评估依据: 形状 和 area .
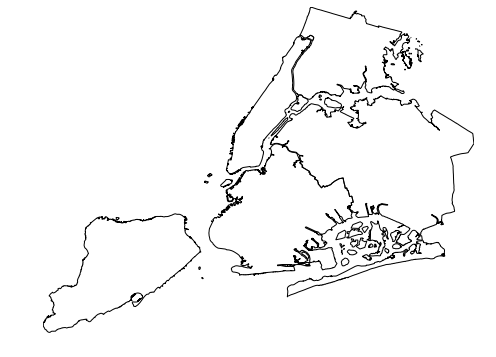
对于足够小的区域,失真量非常小。例如,这张纽约市地图相当准确:
boroughs = gpd.read_file(gplt.datasets.get_path('nyc_boroughs'))
gplt.polyplot(boroughs)
<matplotlib.axes._subplots.AxesSubplot at 0x11d243898>
但有一个更好的方法:使用 投影 .
投影是一种将地球表面上的点映射成二维(如一张纸或一个电脑屏幕)的方法。因为从三维移动到二维本质上是有损耗的,没有投影是完美的,但某些投影在某些情况下肯定比其他投影效果更好。
对于毗邻的美国,最常用的投影是 Albers Equal Area projection . 这个投影的工作原理是将地球环绕在一个圆锥体上,这个圆锥体特别适合于北半球中部附近的位置(而对于两极的位置则特别差)。
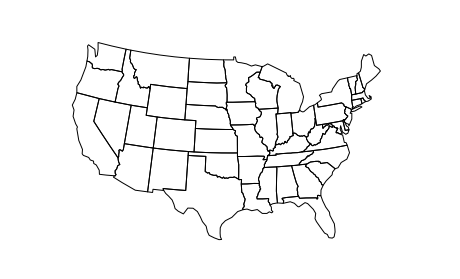
在中向地图添加投影的步骤 geoplot 通过一个 geoplot.crs 对象到 projection 绘图上的参数。例如,这是我们尝试时得到的结果 Albers 在毗邻的美国:
import geoplot.crs as gcrs
gplt.polyplot(contiguous_usa, projection=gcrs.AlbersEqualArea())
<cartopy.mpl.geoaxes.GeoAxesSubplot at 0x11dd02cc0>
以获取 geoplot, refer to the projections reference 在 cartopy 文档 (cartopy 类库在哪 geoplot 依赖于它的投影)。
叠加投影图
的一个关键特征 geoplot 是一种将绘图堆叠在一起的能力。
cities = gpd.read_file(gplt.datasets.get_path('usa_cities'))
ax = gplt.polyplot(
    contiguous_usa,
    projection=gcrs.AlbersEqualArea()
)
gplt.pointplot(cities, ax=ax)
<cartopy.mpl.geoaxes.GeoAxesSubplot at 0x11da21c50>
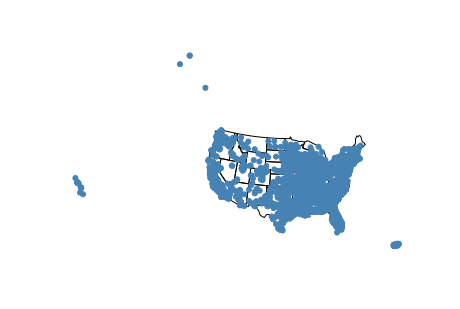
默认情况下, geoplot will set the extent (地块覆盖的区域)到 total_bounds 地图上最后一块地。
然而,假设即使我们有一个完整的美国(加上波多黎各)的数据,我们实际上只想显示相邻美国的数据。一个简单的方法就是设置 extent 参数使用 total_bounds .
ax = gplt.polyplot(
    contiguous_usa,
    projection=gcrs.AlbersEqualArea()
)
gplt.pointplot(cities, ax=ax, extent=contiguous_usa.total_bounds)
<cartopy.mpl.geoaxes.GeoAxesSubplot at 0x11da947f0>
教程中关于 Customizing Plots 解释了 extent 更详细的参数。
子地块上的投影
可以将多个轴组合到一个面板图形中 matplotlib 使用 subplots 功能。此功能对于创建绘图的并排比较非常有用,或者用于将绘图叠加到一个信息量更大的显示中。
import matplotlib.pyplot as plt
import geoplot as gplt
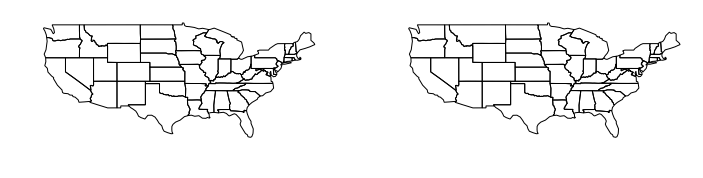
f, axarr = plt.subplots(1, 2, figsize=(12, 4))
gplt.polyplot(contiguous_usa, ax=axarr[0])
gplt.polyplot(contiguous_usa, ax=axarr[1])
<matplotlib.axes._subplots.AxesSubplot at 0x11dc55438>
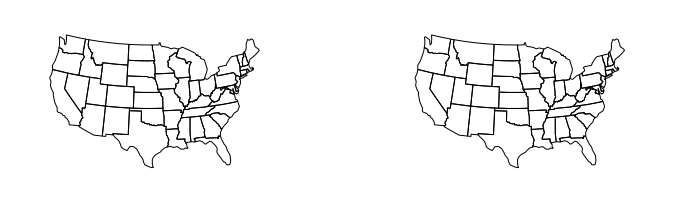
matplotlib 支持使用 projection 参数 subplot_kw .
proj = gcrs.AlbersEqualArea(central_longitude=-98, central_latitude=39.5)
f, axarr = plt.subplots(1, 2, figsize=(12, 4), subplot_kw={
    'projection': proj
})
gplt.polyplot(contiguous_usa, projection=proj, ax=axarr[0])
gplt.polyplot(contiguous_usa, projection=proj, ax=axarr[1])
<cartopy.mpl.geoaxes.GeoAxesSubplot at 0x11ded2b70>
这个 Gallery 包括几个演示,如 Pointplot Scale Functions 演示,说明使用此功能效果不错。
注意,在这个代码示例中,我们为投影指定了一些附加参数。这个 central_longitude=-98 and central_latitude=39.5 parameters set the “center point” around which the points and shapes on the map are reprojected (in this case we use the geographic center of the contiguous United States )
将投影传递给 geoplot 函数, geoplot 将为您推断这些值。但是当把投影直接传递给 matplotlib 你必须自己设置。