使用地理空间数据
本教程的这一部分讨论如何使用 geopandas 和 shapely 在Python中操作地理空间数据。如果您以前从未使用过这些库,或者正在寻找有关它们如何工作的复习资料,则此页适合您!
我建议在本教程中使用 Binder .
坐标参考系
这个 GeoDataFrame 是 pandas DataFrame 使用附着的几何图形:
import pandas as pd; pd.set_option('max_columns', 6)  # Unclutter display.
import geopandas as gpd
import geoplot as gplt

# load the example data
nyc_boroughs = gpd.read_file(gplt.datasets.get_path('nyc_boroughs'))
nyc_boroughs
| BoroCode | BoroName | Shape_Leng | Shape_Area | geometry | |
|---|---|---|---|---|---|
| 0 | 5 | Staten Island | 330385.03697 | 1.623853e+09 | (POLYGON ((-74.05050806403247 40.5664220341608... |
| 1 | 4 | Queens | 861038.47930 | 3.049947e+09 | (POLYGON ((-73.83668274106708 40.5949466970158... |
| 2 | 3 | Brooklyn | 726568.94634 | 1.959432e+09 | (POLYGON ((-73.8670614947212 40.58208797679338... |
| 3 | 1 | Manhattan | 358532.95642 | 6.364422e+08 | (POLYGON ((-74.01092841268033 40.6844914725429... |
| 4 | 2 | Bronx | 464517.89055 | 1.186804e+09 | (POLYGON ((-73.89680883223775 40.7958084451597... |
大多数操作将在 pandas DataFrame 将在一个 GeoDataFrame ,而处理当前几何体的方法并不多。其中最明显的是添加了一个用于存储几何图形的列,可以使用 geometry 属性:
nyc_boroughs.geometry
0    (POLYGON ((-74.05050806403247 40.5664220341608...
1    (POLYGON ((-73.83668274106708 40.5949466970158...
2    (POLYGON ((-73.8670614947212 40.58208797679338...
3    (POLYGON ((-74.01092841268033 40.6844914725429...
4    (POLYGON ((-73.89680883223775 40.7958084451597...
Name: geometry, dtype: object
无论何时,在 GeoDataFrame ,首先要检查它的 坐标参考系 .
A coordinate reference system 或CRS,是一种定义空间中点的位置的系统。您可以使用 crs 属性:
nyc_boroughs.crs
{'init': 'epsg:4326'}
In this case epsg:4326 is the official identifier for what the rest
of us more commonly refer to as “longitude and latitude”. Most
coordinate reference systems have a well-defined EPSG number, which you
can look up using the handy
spatialreference.org
website.
为什么还有经纬度以外的坐标系?例如,美国地理位置服务局维护美国极高精度的地图,为美国各地区维护110个坐标参考系,称为“州平面坐标系”。经纬度使用 spherical coordinates ;州平面坐标系使用“平地” Cartesian coordinate . 因此,状态平面坐标在计算上要简单得多,同时对大多数应用程序保持足够精确(在其“区域”内)。
由于这个原因,州平面坐标系统仍然在整个政府中使用。例如,以下是从纽约市发布的MapPLUTO数据集中获取的数据样本:
nyc_map_pluto_sample = gpd.read_file(gplt.datasets.get_path('nyc_map_pluto_sample'))
nyc_map_pluto_sample
| Borough | Block | Lot | ... | Shape_Leng | Shape_Area | geometry | |
|---|---|---|---|---|---|---|---|
| 0 | MN | 1 | 10 | ... | 12277.824113 | 7.550340e+06 | POLYGON ((979561.8712409735 191884.2491553128,... |
| 1 | MN | 1 | 101 | ... | 3940.840373 | 5.018974e+05 | POLYGON ((972382.8255597204 190647.2667211443,... |
| 2 | MN | 1 | 101 | ... | 3940.840373 | 5.018974e+05 | POLYGON ((972428.8290766329 190679.1751218885,... |
| 3 | MN | 1 | 101 | ... | 3940.840373 | 5.018974e+05 | POLYGON ((972058.3399882168 190689.2800885588,... |
| 4 | MN | 1 | 201 | ... | 6306.268341 | 1.148539e+06 | POLYGON ((973154.7118112147 194614.3312935531,... |
| 5 | MN | 2 | 1 | ... | 2721.060649 | 1.008250e+05 | POLYGON ((980915.0020648837 194319.1402828991,... |
| 6 | MN | 2 | 2 | ... | 2411.869687 | 8.724423e+04 | POLYGON ((981169.004181549 194678.8213220537, ... |
7 rows × 90 columns
这些数据存储在长岛州平面坐标系中 (EPSG 2263 _). 不幸的是,CRS on read被错误地设置为 epsg:4326 我们必须自己把它设置到正确的坐标系。
nyc_map_pluto_sample.crs = {'init': 'epsg:2263'}
nyc_map_pluto_sample.crs
{'init': 'epsg:2263'}
根据数据集, crs may be set to either epsg:<INT> or to a raw proj4 投影字典。底线是,读入数据集后,始终验证数据集坐标参照系是否设置为其文档应设置的坐标系。
如果你确定你的坐标不是经纬度,通常你要做的第一件事就是转换成它。 to_crs 这是否:
nyc_map_pluto_sample = nyc_map_pluto_sample.to_crs(epsg=4326)
nyc_map_pluto_sample
| Borough | Block | Lot | ... | Shape_Leng | Shape_Area | geometry | |
|---|---|---|---|---|---|---|---|
| 0 | MN | 1 | 10 | ... | 12277.824113 | 7.550340e+06 | POLYGON ((-74.0169058260488 40.69335342975063,... |
| 1 | MN | 1 | 101 | ... | 3940.840373 | 5.018974e+05 | POLYGON ((-74.04279194703045 40.68995148413111... |
| 2 | MN | 1 | 101 | ... | 3940.840373 | 5.018974e+05 | POLYGON ((-74.04262611856618 40.69003912689961... |
| 3 | MN | 1 | 101 | ... | 3940.840373 | 5.018974e+05 | POLYGON ((-74.04396208819837 40.69006636010664... |
| 4 | MN | 1 | 201 | ... | 6306.268341 | 1.148539e+06 | POLYGON ((-74.04001513069795 40.7008411559464,... |
| 5 | MN | 2 | 1 | ... | 2721.060649 | 1.008250e+05 | POLYGON ((-74.01202751677701 40.70003725302833... |
| 6 | MN | 2 | 2 | ... | 2411.869687 | 8.724423e+04 | POLYGON ((-74.01111163437271 40.70102458543801... |
7 rows × 90 columns
协调顺序
shapely ,类库 geopandas 用于存储其几何图形,使用“现代”经纬度 (x, y) 协调秩序。这与“历史”经纬度不同 (y, x) 协调秩序。“在野外”的数据集可以是任意一种格式。
我们没有办法 geopandas 了解数据集在加载时是采用一种格式还是另一种格式。将数据集转换为正确的坐标系后,请务必再次检查几何图形是否也处于正确的坐标顺序。
这是一个很容易犯的错误,人们总是在犯这个错误!
确保坐标顺序正确的最快方法是知道数据的正确x坐标和y坐标应该是什么,然后仔细观察。
几何形状类型
世界的每一个元素 geometry column in a GeoDataFrame is a shapely object. Shapely 是一个几何操作库,用于在空间中操纵几何图形,是处理形状数据的首选pythonapi。
shapely 仅定义少数几种几何图形类型:
Point-一个要点。MultiPoint-一组点。LineString-线段。MultiLineString-一组线(如一系列相连的线段)。LinearRing-封闭的线条集合。基本上是一个面积为零的多边形。Polygon-沿着一系列点的闭合形状。MultiPolygon-多边形的集合。
你可以查一下 type 使用 type 操作员:
type(nyc_boroughs.geometry.iloc[0])
shapely.geometry.multipolygon.MultiPolygon
type(nyc_map_pluto_sample.geometry.iloc[0])
shapely.geometry.polygon.Polygon
执行几何运算
这个 shapely user manual 提供可使用库执行的大量几何操作列表:从简单操作(如平移和变换)到更复杂的操作(如多边形缓冲)。
您可以使用本机方法对对象中的几何体逐对象应用变换 pandas map function on the geometry column. For example, here is one way of deconstructing a set of Polygon or MultiPolygon objects into simplified convex hulls :
%time gplt.polyplot(nyc_boroughs.geometry.map(lambda shp: shp.convex_hull))
CPU times: user 62.7 ms, sys: 2.64 ms, total: 65.3 ms
Wall time: 71.6 ms
<matplotlib.axes._subplots.AxesSubplot at 0x11c61d7b8>
您可以用这种方法对图形执行任意复杂的几何变换。然而, most common operations 以优化的形式提供,作为 geopandas 应用程序编程接口。下面是一种创建凸面外壳的快速方法,例如:
%time nyc_boroughs.convex_hull
CPU times: user 55.6 ms, sys: 6.45 ms, total: 62.1 ms
Wall time: 39.9 ms
0    POLYGON ((-74.24712436215984 40.49611539517034...
1    POLYGON ((-73.94073681665428 40.54182008715522...
2    POLYGON ((-73.98336058039274 40.56952999448672...
3    POLYGON ((-74.02305574749596 40.68291694544512...
4    POLYGON ((-73.87830680057651 40.78535662050845...
dtype: object
深入研究地理空间数据转换超出了本简短指南的范围。我只想说它们有很多,你可以通过咨询 geopandas 和 shapely 文档。
定义自己的几何图形
在本教程的这一节中,我们将重点介绍 shapely 很可能会出现:定义自己的几何图形。
在上面的例子中,我们直接从地理空间文件中读取了一个GeoDataFrame:我们的自治区信息存储在 GeoJSON 格式,而我们的建筑足迹是 Shapefile . 如果我们把地理空间数据嵌入到一个普通的 CSV 或 JSON 文件,读入一个普通的 pandas DataFrame 是吗?
nyc_collisions_sample = pd.read_csv(gplt.datasets.get_path('nyc_collisions_sample'))
nyc_collisions_sample
| LATITUDE | LONGITUDE | DATE | TIME | |
|---|---|---|---|---|
| 0 | 40.767373 | -73.950057 | 04/16/2016 | 4:13 |
| 1 | 40.862670 | -73.909039 | 04/16/2016 | 4:30 |
| 2 | 40.716507 | -73.961275 | 04/16/2016 | 4:30 |
| 3 | 40.749788 | -73.987768 | 04/16/2016 | 4:30 |
| 4 | 40.702401 | 73.960496 | 04/16/2016 | 4:50 |
以非地理空间格式保存包含轻型地理空间数据的数据集(例如点,可能是线段,但通常不是整个多边形)是非常常见的。
在这种情况下,您可以导入 shapely 直接使用它来定义我们自己的几何图形,然后初始化 GeoDataFrame . 这个 pandas apply 功能是最好的:
from shapely.geometry import Point

collision_points = nyc_collisions_sample.apply(
    lambda srs: Point(float(srs['LONGITUDE']), float(srs['LATITUDE'])),
    axis='columns'
)
collision_points
0           POINT (-73.950057 40.767373)
1    POINT (-73.90903900000001 40.86267)
2           POINT (-73.961275 40.716507)
3           POINT (-73.987768 40.749788)
4    POINT (73.96049599999999 40.702401)
dtype: object
从那里我们把这个几何级数传递给 geometry 性质 GeoDataFrame initializer:
import geopandas as gpd
nyc_collisions_sample_geocoded = gpd.GeoDataFrame(nyc_collisions_sample, geometry=collision_points)
nyc_collisions_sample_geocoded
| LATITUDE | LONGITUDE | DATE | TIME | geometry | |
|---|---|---|---|---|---|
| 0 | 40.767373 | -73.950057 | 04/16/2016 | 4:13 | POINT (-73.950057 40.767373) |
| 1 | 40.862670 | -73.909039 | 04/16/2016 | 4:30 | POINT (-73.90903900000001 40.86267) |
| 2 | 40.716507 | -73.961275 | 04/16/2016 | 4:30 | POINT (-73.961275 40.716507) |
| 3 | 40.749788 | -73.987768 | 04/16/2016 | 4:30 | POINT (-73.987768 40.749788) |
| 4 | 40.702401 | 73.960496 | 04/16/2016 | 4:50 | POINT (73.96049599999999 40.702401) |
在大多数情况下,CSV中提供的具有地理空间信息的数据将是与单个坐标相对应的点数据。但是,有时可能希望定义更复杂的几何图形:例如,正方形区域和 也许 吧 甚至是复杂的多边形。虽然我们不讨论这些情况,但它们非常类似于我们在这里展示的非常简单的点情况。有关此任务的进一步参考,请参阅 shapely 文档。
连接现有几何图形
有时必要的地理空间数据完全在别处。
假设现在我们有了各州关于肥胖的信息。
obesity = pd.read_csv(gplt.datasets.get_path('obesity_by_state'), sep='\t')
obesity.head()
| State | Percent | |
|---|---|---|
| 0 | Alabama | 32.4 |
| 1 | Missouri | 30.4 |
| 2 | Alaska | 28.4 |
| 3 | Montana | 24.6 |
| 4 | Arizona | 26.8 |
我们想把这些信息放在地图上。但我们没有任何几何学!
我们将再次定义一个几何体。但这次,我们不需要编写自己的数据,而是需要找到具有状态形状的数据,并将该数据与该数据关联起来。在其他情况下,可能有其他形状:警察辖区、调查区等。以下就是这样一个数据集:
contiguous_usa = gpd.read_file(gplt.datasets.get_path('contiguous_usa'))
contiguous_usa.head()
| state | adm1_code | population | geometry | |
|---|---|---|---|---|
| 0 | Minnesota | USA-3514 | 5303925 | POLYGON ((-89.59940899999999 48.010274, -89.48... |
| 1 | Montana | USA-3515 | 989415 | POLYGON ((-111.194189 44.561156, -111.291548 4... |
| 2 | North Dakota | USA-3516 | 672591 | POLYGON ((-96.601359 46.351357, -96.5389080000... |
| 3 | Idaho | USA-3518 | 1567582 | POLYGON ((-111.049728 44.488163, -111.050245 4... |
| 4 | Washington | USA-3519 | 6724540 | POLYGON ((-116.998073 46.33017, -116.906528 46... |
简单的 join 解决问题:
result = contiguous_usa.set_index('state').join(obesity.set_index('State'))
result.head()
| adm1_code | population | geometry | Percent | |
|---|---|---|---|---|
| state | ||||
| Minnesota | USA-3514 | 5303925 | POLYGON ((-89.59940899999999 48.010274, -89.48... | 25.5 |
| Montana | USA-3515 | 989415 | POLYGON ((-111.194189 44.561156, -111.291548 4... | 24.6 |
| North Dakota | USA-3516 | 672591 | POLYGON ((-96.601359 46.351357, -96.5389080000... | 31.0 |
| Idaho | USA-3518 | 1567582 | POLYGON ((-111.049728 44.488163, -111.050245 4... | 29.6 |
| Washington | USA-3519 | 6724540 | POLYGON ((-116.998073 46.33017, -116.906528 46... | 27.2 |
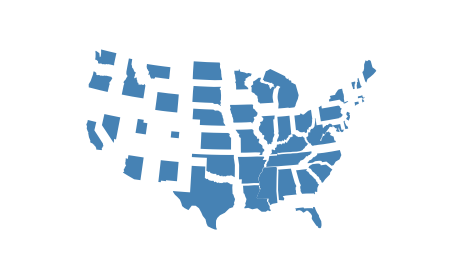
现在我们可以绘制它:
import geoplot.crs as gcrs
gplt.cartogram(result, scale='Percent', projection=gcrs.AlbersEqualArea())
<cartopy.mpl.geoaxes.GeoAxesSubplot at 0x11c3bda20>
保存格式
可以使用从地理空间文件格式中读取数据 GeoDataFrame.from_file . 可以使用将数据写入地理空间文件格式 GeoDataFrame.to_file . 默认情况下,这些方法将推断文件格式并保存到 Shapefile 分别是。要指定显式文件格式,请将该格式的名称传递给 driver 争论。例如:
nyc_boroughs.to_file('boroughs.geojson', driver='GeoJSON')
地理空间数据最简单且越来越常见的保存格式是 GeoJSON . geojson文件可能具有 .geojson 或 .json 扩展,并以可读格式存储数据:
{
  "type": "Feature",
  "geometry": {
    "type": "Point",
    "coordinates": [125.6, 10.1]
  },
  "properties": {
    "name": "Dinagat Islands"
  }
}
从历史上讲,最常见的地理空间数据格式是 Shapefile . shapefile实际上不是文件,而是文件夹或文件夹中的文件组 zip 将这些数据一起存档可以对有关数据的非常复杂的信息进行编码。shapefile是一种二进制文件格式,因此它们不像GeoJSON文件那样是人类可读的,但是可以有效地对过于复杂的数据进行编码,以便于在GeoJSON中存储。
这是两种最著名的文件格式,但是 many many others . 获取支持的地理空间文件格式列表 geopandas refer to the fiona user manual .