注解
点击 here 下载完整的示例代码
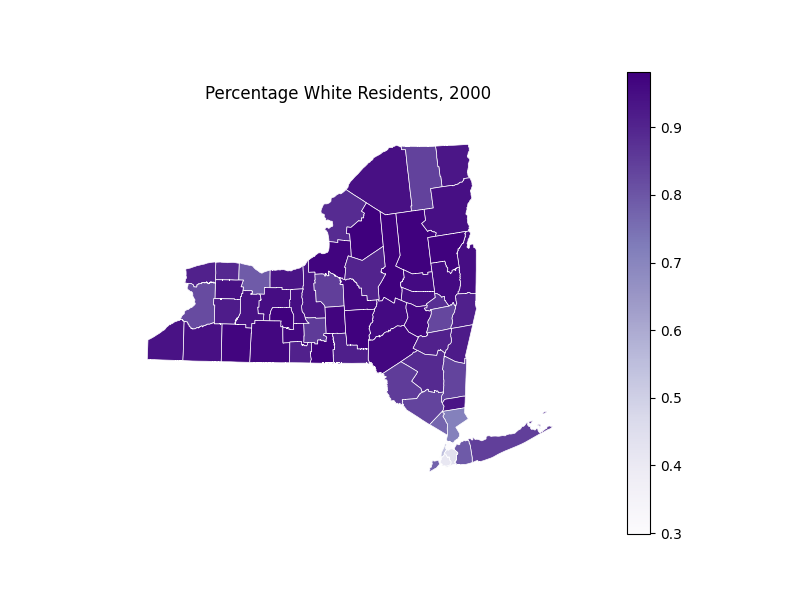
纽约州人口统计中心
这个例子描绘了2000年人口普查中纽约州按县划分的自称为“白人”的居民的百分比。纽约市的种族多样性远远高于该州其他地区。
import geopandas as gpd
import geoplot as gplt
import geoplot.crs as gcrs
import matplotlib.pyplot as plt

ny_census_tracts = gpd.read_file(gplt.datasets.get_path('ny_census'))
ny_census_tracts = ny_census_tracts.assign(
    percent_white=ny_census_tracts['WHITE'] / ny_census_tracts['POP2000']
)

gplt.choropleth(
    ny_census_tracts,
    hue='percent_white',
    cmap='Purples', linewidth=0.5,
    edgecolor='white',
    legend=True,
    projection=gcrs.AlbersEqualArea()
)
plt.title("Percentage White Residents, 2000")
plt.savefig("ny-state-demographics.png", bbox_inches='tight', pad_inches=0.1)
脚本的总运行时间: (0分2.461秒)