注解
点击 here 下载完整的示例代码
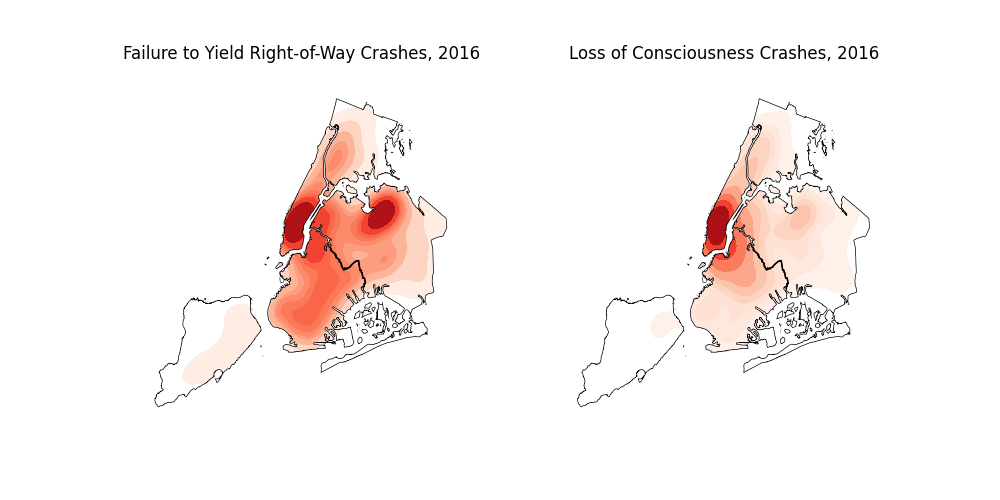
两起纽约市交通事故成因分析
本例显示了两个常见的促成因素的交通事故密度:失去意识和未能让出通行权。这些因素在地理空间上的分布非常不同:意识丧失事故更多地发生在曼哈顿。
出:
/tmp/vpy/lib/python3.8/site-packages/seaborn/_decorators.py:36: FutureWarning: Pass the following variable as a keyword arg: y. From version 0.12, the only valid positional argument will be `data`, and passing other arguments without an explicit keyword will result in an error or misinterpretation.
  warnings.warn(
/tmp/vpy/lib/python3.8/site-packages/seaborn/distributions.py:1676: UserWarning: `shade_lowest` is now deprecated in favor of `thresh`. Setting `thresh=0.05`, but please update your code.
  warnings.warn(msg, UserWarning)
import geopandas as gpd
import geoplot as gplt
import geoplot.crs as gcrs
import matplotlib.pyplot as plt

nyc_boroughs = gpd.read_file(gplt.datasets.get_path('nyc_boroughs'))
nyc_collision_factors = gpd.read_file(gplt.datasets.get_path('nyc_collision_factors'))


proj = gcrs.AlbersEqualArea(central_latitude=40.7128, central_longitude=-74.0059)
fig = plt.figure(figsize=(10,5))
ax1 = plt.subplot(121, projection=proj)
ax2 = plt.subplot(122, projection=proj)

gplt.kdeplot(
    nyc_collision_factors[
        nyc_collision_factors['CONTRIBUTING FACTOR VEHICLE 1'] == "Failure to Yield Right-of-Way"
    ],
    cmap='Reds',
    projection=proj,
    shade=True, shade_lowest=False,
    clip=nyc_boroughs.geometry,
    ax=ax1
)
gplt.polyplot(nyc_boroughs, zorder=1, ax=ax1)
ax1.set_title("Failure to Yield Right-of-Way Crashes, 2016")

gplt.kdeplot(
    nyc_collision_factors[
        nyc_collision_factors['CONTRIBUTING FACTOR VEHICLE 1'] == "Lost Consciousness"
    ],
    cmap = 'Reds',
    projection=proj,
    shade=True, shade_lowest=False,
    clip=nyc_boroughs.geometry,
    ax=ax2
)
gplt.polyplot(nyc_boroughs, zorder=1, ax=ax2)
ax2.set_title("Loss of Consciousness Crashes, 2016")

plt.savefig("nyc-collision-factors.png", bbox_inches='tight', pad_inches=0.1)
脚本的总运行时间: (6分4.209秒)