注解
点击 here 下载完整的示例代码
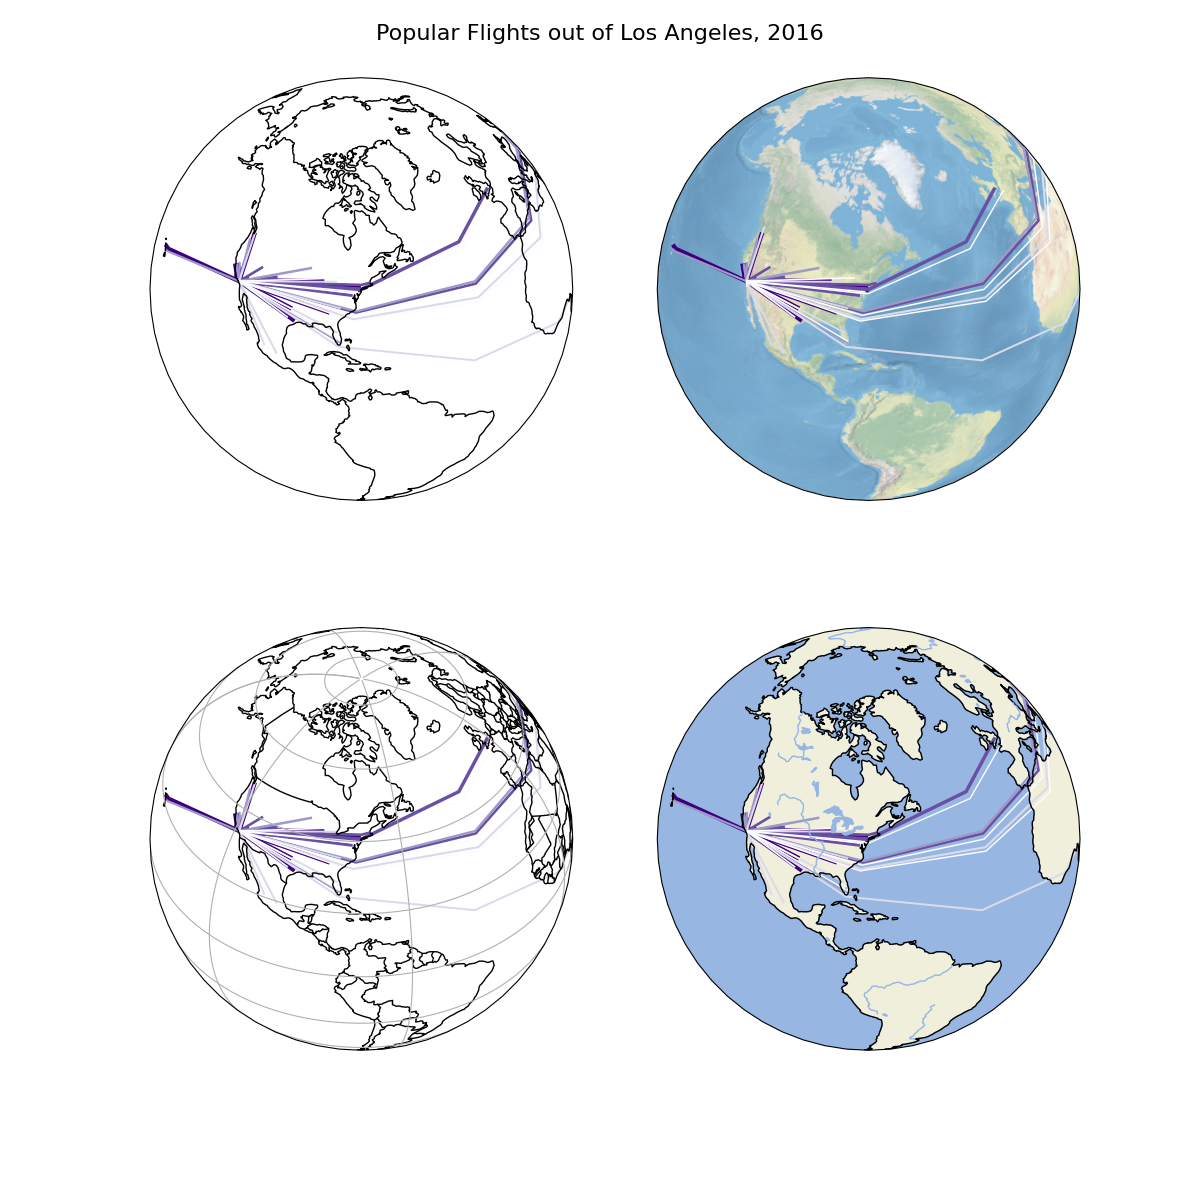
Sankey的洛杉矶航班量与Cartopy地球仪
这个例子描绘了从洛杉矶国际机场起飞的商业航班的客运量。中提供了一些地球仪修改选项 cartopy 演示。访问 the cartopy docs 更多信息。
出:
/pb1/rst_repos/git/geoplot/examples/plot_los_angeles_flights.py:31: DeprecationWarning: The outline_patch property is deprecated. Use GeoAxes.spines['geo'] or the default Axes properties instead.
  ax.outline_patch.set_visible(True)
/pb1/rst_repos/git/geoplot/examples/plot_los_angeles_flights.py:38: DeprecationWarning: The outline_patch property is deprecated. Use GeoAxes.spines['geo'] or the default Axes properties instead.
  ax.outline_patch.set_visible(True)
/pb1/rst_repos/git/geoplot/examples/plot_los_angeles_flights.py:45: DeprecationWarning: The outline_patch property is deprecated. Use GeoAxes.spines['geo'] or the default Axes properties instead.
  ax.outline_patch.set_visible(True)
/pb1/rst_repos/git/geoplot/examples/plot_los_angeles_flights.py:54: DeprecationWarning: The outline_patch property is deprecated. Use GeoAxes.spines['geo'] or the default Axes properties instead.
  ax.outline_patch.set_visible(True)
/tmp/vpy/lib/python3.8/site-packages/cartopy/io/__init__.py:260: DownloadWarning: Downloading: https://naciscdn.org/naturalearth/110m/physical/ne_110m_ocean.zip
  warnings.warn('Downloading: {}'.format(url), DownloadWarning)
/tmp/vpy/lib/python3.8/site-packages/cartopy/io/__init__.py:260: DownloadWarning: Downloading: https://naciscdn.org/naturalearth/110m/physical/ne_110m_lakes.zip
  warnings.warn('Downloading: {}'.format(url), DownloadWarning)
/tmp/vpy/lib/python3.8/site-packages/cartopy/io/__init__.py:260: DownloadWarning: Downloading: https://naciscdn.org/naturalearth/110m/physical/ne_110m_rivers_lake_centerlines.zip
  warnings.warn('Downloading: {}'.format(url), DownloadWarning)
import geopandas as gpd
import geoplot as gplt
import geoplot.crs as gcrs
import matplotlib.pyplot as plt
import cartopy
import mapclassify as mc

la_flights = gpd.read_file(gplt.datasets.get_path('la_flights'))
scheme = mc.Quantiles(la_flights['Passengers'], k=5)

f, axarr = plt.subplots(2, 2, figsize=(12, 12), subplot_kw={
    'projection': gcrs.Orthographic(central_latitude=40.7128, central_longitude=-74.0059)
})
plt.suptitle('Popular Flights out of Los Angeles, 2016', fontsize=16)
plt.subplots_adjust(top=0.95)

ax = gplt.sankey(
    la_flights, scale='Passengers', hue='Passengers', cmap='Purples', scheme=scheme, ax=axarr[0][0]
)
ax.set_global()
ax.outline_patch.set_visible(True)
ax.coastlines()

ax = gplt.sankey(
    la_flights, scale='Passengers', hue='Passengers', cmap='Purples', scheme=scheme, ax=axarr[0][1]
)
ax.set_global()
ax.outline_patch.set_visible(True)
ax.stock_img()

ax = gplt.sankey(
    la_flights, scale='Passengers', hue='Passengers', cmap='Purples', scheme=scheme, ax=axarr[1][0]
)
ax.set_global()
ax.outline_patch.set_visible(True)
ax.gridlines()
ax.coastlines()
ax.add_feature(cartopy.feature.BORDERS)

ax = gplt.sankey(
    la_flights, scale='Passengers', hue='Passengers', cmap='Purples', scheme=scheme, ax=axarr[1][1]
)
ax.set_global()
ax.outline_patch.set_visible(True)
ax.coastlines()
ax.add_feature(cartopy.feature.LAND)
ax.add_feature(cartopy.feature.OCEAN)
ax.add_feature(cartopy.feature.LAKES)
ax.add_feature(cartopy.feature.RIVERS)

plt.savefig("los-angeles-flights.png", bbox_inches='tight', pad_inches=0.1)
脚本的总运行时间: (0分19.887秒)