注解
点击 here 下载完整的示例代码
加利福尼亚州的乔洛佩斯区,有其他的分格方案
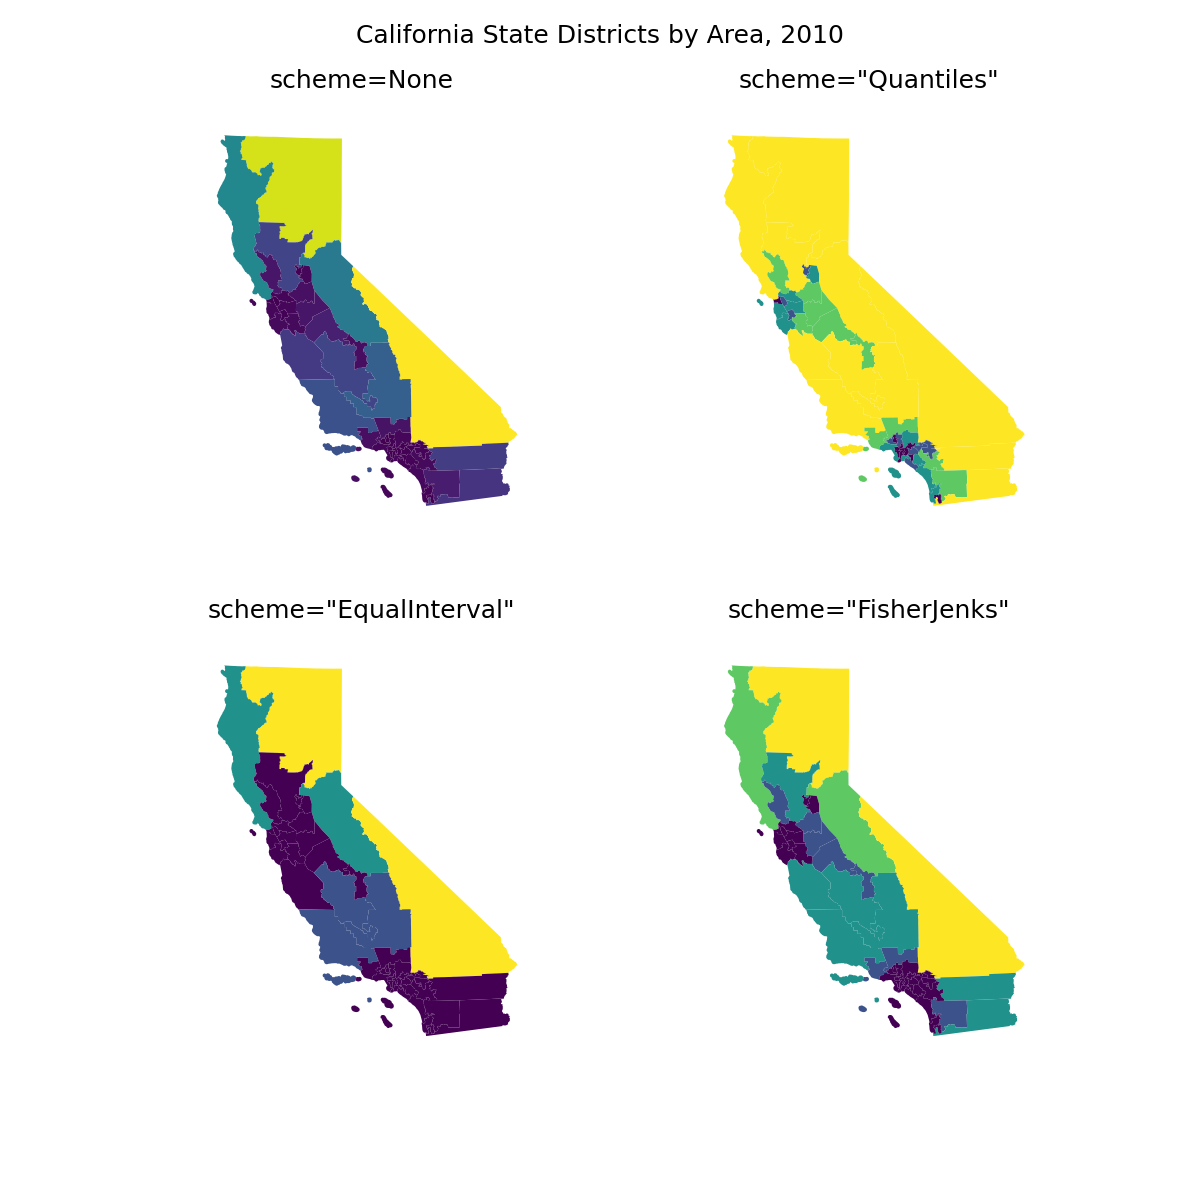
此示例演示了中可用的连续和分类装箱方案 geoplot 在加州国会选区的样本数据集上。装箱方案(或分类器)是一种方法,用于将观察序列拆分为若干箱(类)。也有可能没有装箱方案,在这种情况下,数据通过 cmap 原来如此。
演示的选项包括:
scheme=None—一个连续的颜色映射。
scheme=“Quantiles”-对数据进行分类,使分类包含相等数量的样本。
scheme=“EqualInterval”-存储数据,使存储单元具有相等的长度。
scheme=“Fisher-jenks”-使用Fisher自然间断优化程序对数据进行分类。
要了解有关颜色贴图的更多信息,请参阅 Customizing Plots 参考文件。
这个演示展示了中可用的分类器的一小部分 mapclassify ,类库 geoplot 此功能依赖于。了解更多 mapclassify ,包括如何建立自己的自定义 UserDefined 分类器,参见 the mapclassify docs .
出:
/pb1/rst_repos/git/geoplot/examples/plot_california_districts.py:36: UserWarning: Geometry is in a geographic CRS. Results from 'area' are likely incorrect. Use 'GeoSeries.to_crs()' to re-project geometries to a projected CRS before this operation.

  cali = cali.assign(area=cali.geometry.area)
/pb1/rst_repos/git/geoplot/examples/plot_california_districts.py:48: UserWarning: Geometry is in a geographic CRS. Results from 'area' are likely incorrect. Use 'GeoSeries.to_crs()' to re-project geometries to a projected CRS before this operation.

  scheme = mc.Quantiles(cali.area, k=5)
/pb1/rst_repos/git/geoplot/examples/plot_california_districts.py:54: UserWarning: Geometry is in a geographic CRS. Results from 'area' are likely incorrect. Use 'GeoSeries.to_crs()' to re-project geometries to a projected CRS before this operation.

  scheme = mc.EqualInterval(cali.area, k=5)
/pb1/rst_repos/git/geoplot/examples/plot_california_districts.py:60: UserWarning: Geometry is in a geographic CRS. Results from 'area' are likely incorrect. Use 'GeoSeries.to_crs()' to re-project geometries to a projected CRS before this operation.

  scheme = mc.FisherJenks(cali.area, k=5)
import geopandas as gpd
import geoplot as gplt
import geoplot.crs as gcrs
import mapclassify as mc
import matplotlib.pyplot as plt

cali = gpd.read_file(gplt.datasets.get_path('california_congressional_districts'))
cali = cali.assign(area=cali.geometry.area)


proj=gcrs.AlbersEqualArea(central_latitude=37.16611, central_longitude=-119.44944)
fig, axarr = plt.subplots(2, 2, figsize=(12, 12), subplot_kw={'projection': proj})

gplt.choropleth(
    cali, hue='area', linewidth=0, scheme=None, ax=axarr[0][0]
)
axarr[0][0].set_title('scheme=None', fontsize=18)

import mapclassify as mc
scheme = mc.Quantiles(cali.area, k=5)
gplt.choropleth(
    cali, hue='area', linewidth=0, scheme=scheme, ax=axarr[0][1]
)
axarr[0][1].set_title('scheme="Quantiles"', fontsize=18)

scheme = mc.EqualInterval(cali.area, k=5)
gplt.choropleth(
    cali, hue='area', linewidth=0, scheme=scheme, ax=axarr[1][0]
)
axarr[1][0].set_title('scheme="EqualInterval"', fontsize=18)

scheme = mc.FisherJenks(cali.area, k=5)
gplt.choropleth(
    cali, hue='area', linewidth=0, scheme=scheme, ax=axarr[1][1]
)
axarr[1][1].set_title('scheme="FisherJenks"', fontsize=18)

plt.subplots_adjust(top=0.92)
plt.suptitle('California State Districts by Area, 2010', fontsize=18)

fig = plt.gcf()
plt.savefig("boston-airbnb-kde.png", bbox_inches='tight', pad_inches=0.1)
脚本的总运行时间: (0分5.797秒)