备注
Go to the end 下载完整的示例代码。
Web地图磁贴服务时间维度演示#
这个例子进一步展示了Cartopy中WMSG的支持。可选的关键字参数可以提供给OGC WMSG“gettile”方法。这允许为支持它的WMSG层指定“时间”维度。
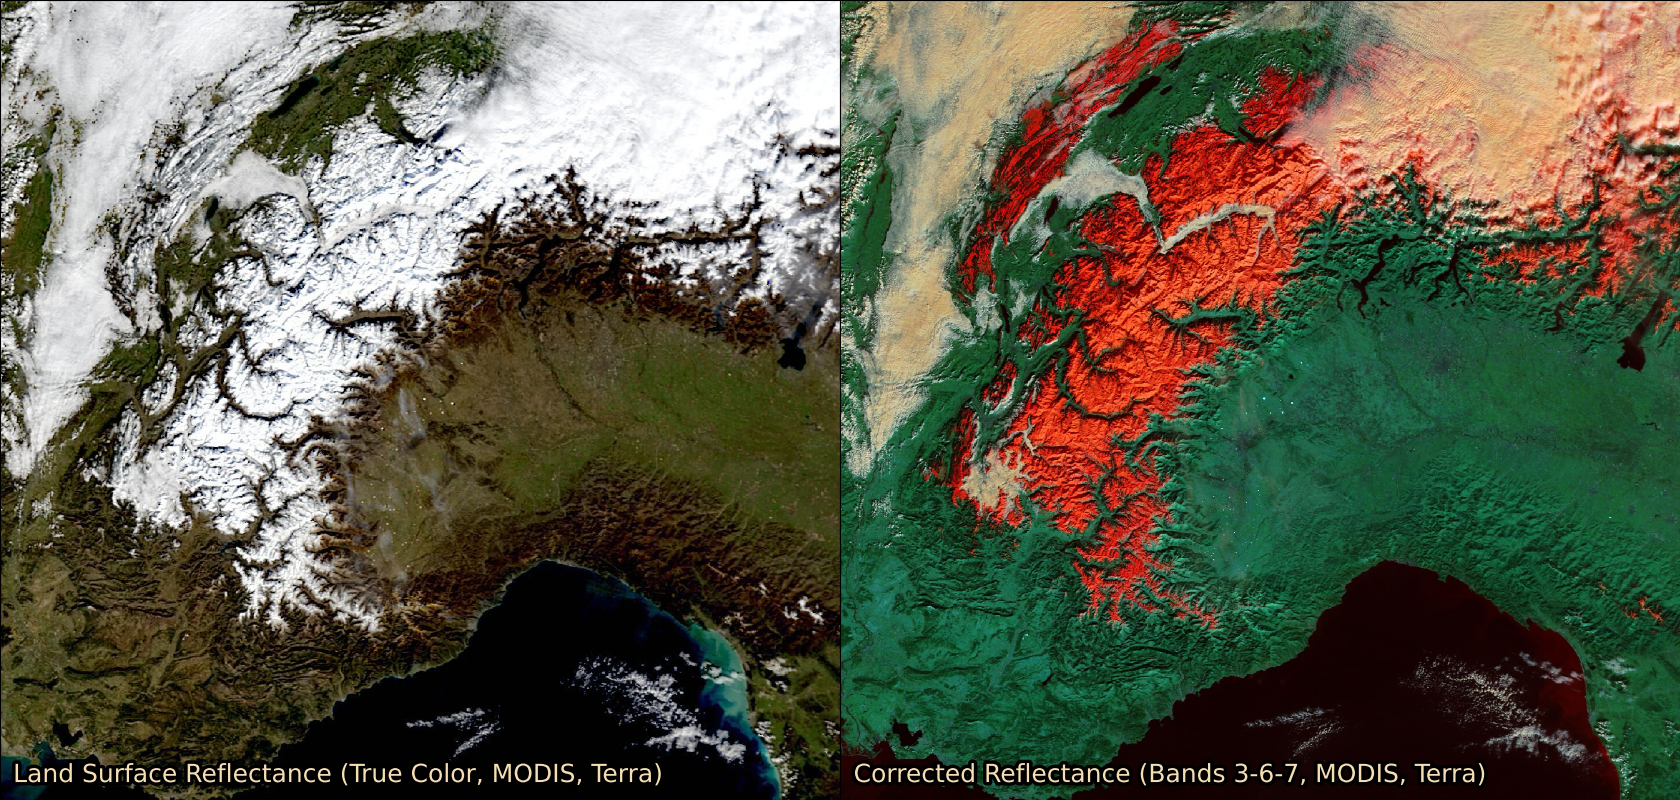
该示例显示了2016年2月5日从NASA全球图像浏览服务检索的卫星图像。左侧显示了真彩色分辨率分辨率成像图像,右侧显示了分辨率成像伪色“雪”。
/xpy/lib/python3.13/site-packages/owslib/wmts.py:861: FutureWarning: Truth-testing of elements was a source of confusion and will always return True in future versions. Use specific 'len(elem)' or 'elem is not None' test instead.
  if current and current.text == 'true':
/xpy/lib/python3.13/site-packages/owslib/wmts.py:658: RuntimeWarning: TileMatrixLimits with tileMatrix "1" already exists
  warnings.warn(msg, RuntimeWarning)
/xpy/lib/python3.13/site-packages/owslib/wmts.py:658: RuntimeWarning: TileMatrixLimits with tileMatrix "2" already exists
  warnings.warn(msg, RuntimeWarning)
/xpy/lib/python3.13/site-packages/owslib/wmts.py:658: RuntimeWarning: TileMatrixLimits with tileMatrix "3" already exists
  warnings.warn(msg, RuntimeWarning)
/xpy/lib/python3.13/site-packages/owslib/wmts.py:658: RuntimeWarning: TileMatrixLimits with tileMatrix "4" already exists
  warnings.warn(msg, RuntimeWarning)
/xpy/lib/python3.13/site-packages/owslib/wmts.py:658: RuntimeWarning: TileMatrixLimits with tileMatrix "5" already exists
  warnings.warn(msg, RuntimeWarning)
/xpy/lib/python3.13/site-packages/owslib/wmts.py:658: RuntimeWarning: TileMatrixLimits with tileMatrix "6" already exists
  warnings.warn(msg, RuntimeWarning)
from matplotlib import patheffects
import matplotlib.pyplot as plt
from owslib.wmts import WebMapTileService

import cartopy.crs as ccrs


def main():
    # URL of NASA GIBS
    url = 'https://gibs.earthdata.nasa.gov/wmts/epsg4326/best/wmts.cgi'
    wmts = WebMapTileService(url)

    # Layers for MODIS true color and snow RGB
    layers = ['MODIS_Terra_SurfaceReflectance_Bands143',
              'MODIS_Terra_CorrectedReflectance_Bands367']

    date_str = '2016-02-05'

    # Plot setup
    plot_crs = ccrs.Mercator()
    geodetic_crs = ccrs.Geodetic()
    x0, y0 = plot_crs.transform_point(4.6, 43.1, geodetic_crs)
    x1, y1 = plot_crs.transform_point(11.0, 47.4, geodetic_crs)
    ysize = 8
    xsize = 2 * ysize * (x1 - x0) / (y1 - y0)
    fig = plt.figure(figsize=(xsize, ysize), dpi=100)

    for layer, offset in zip(layers, [0, 0.5]):
        ax = fig.add_axes([offset, 0, 0.5, 1], projection=plot_crs)
        ax.set_xlim((x0, x1))
        ax.set_ylim((y0, y1))
        ax.add_wmts(wmts, layer, wmts_kwargs={'time': date_str})
        txt = ax.text(4.7, 43.2, wmts[layer].title, fontsize=18, color='wheat',
                      transform=geodetic_crs)
        txt.set_path_effects([patheffects.withStroke(linewidth=5,
                                                     foreground='black')])
    plt.show()


if __name__ == '__main__':
    main()
Total running time of the script: (0分46.073秒)
Gallery generated by Sphinx-Gallery _