备注
Go to the end 下载完整的示例代码。
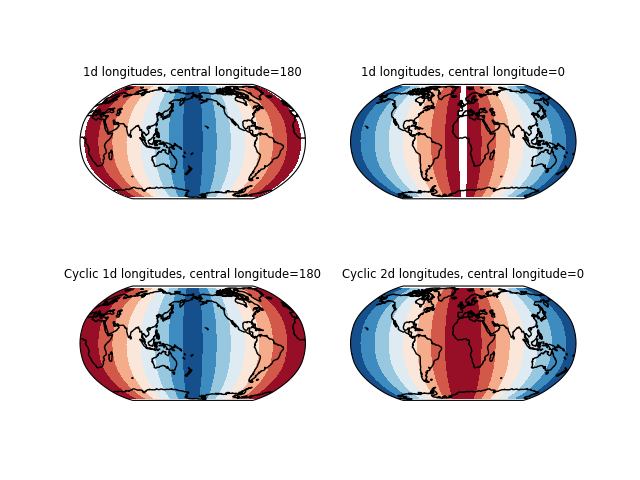
添加循环点以帮助包装全球数据#
Cartopy以直角投影坐标表示数据,这意味着350度的经度与0度的距离不仅仅是10度,因为它以球坐标表示。这意味着绘制方法不会绘制最后一个和第一个经度之间的数据。
为了帮助实现这一点,可以使用循环点扩展数据和经度/纬度坐标数组,以缩小这一差距。常规 add_cyclic 重复最后一个数据列。它还可以将第一个经度加上循环关键字(默认为360)添加到经度数组的结尾,以便结尾大写字母处的数据值将接近于结束点。
import matplotlib.pyplot as plt
import numpy as np

import cartopy.crs as ccrs
import cartopy.util as cutil


def main():

    # data with longitude centers from 0 to 360
    nlon = 24
    nlat = 12
    # 7.5, 22.5, ..., 337.5, 352.5
    dlon = 360//nlon
    lon = np.linspace(dlon/2., 360.-dlon/2., nlon)
# -82.5, -67.5, ..., 67.5, 82.5
    dlat = 180//nlat
    lat = np.linspace(-90.+dlat/2., 90.-dlat/2., nlat)
    # 0, 1, ..., 10, 11, 11, 10, ..., 1, 0
    data = np.concatenate((np.arange(nlon // 2),
                           np.arange(nlon // 2)[::-1]))
    data = np.tile(data, nlat).reshape((nlat, nlon))

    fig = plt.figure()

    # plot with central longitude 180
    ax1 = fig.add_subplot(2, 2, 1,
                          projection=ccrs.Robinson(central_longitude=180))
    ax1.set_title("1d longitudes, central longitude=180",
                  fontsize='small')
    ax1.set_global()
    ax1.contourf(lon, lat, data,
                 transform=ccrs.PlateCarree(), cmap='RdBu')
    ax1.coastlines()

    # plot with central longitude 0
    ax2 = fig.add_subplot(2, 2, 2,
                          projection=ccrs.Robinson(central_longitude=0))
    ax2.set_title("1d longitudes, central longitude=0",
                  fontsize='small')
    ax2.set_global()
    ax2.contourf(lon, lat, data,
                 transform=ccrs.PlateCarree(), cmap='RdBu')
    ax2.coastlines()

    # add cyclic points to data and longitudes
    # latitudes are unchanged in 1-dimension
    cdata, clon, clat = cutil.add_cyclic(data, lon, lat)
    ax3 = fig.add_subplot(2, 2, 3,
                          projection=ccrs.Robinson(central_longitude=180))
    ax3.set_title("Cyclic 1d longitudes, central longitude=180",
                  fontsize='small')
    ax3.set_global()
    ax3.contourf(clon, clat, cdata,
                 transform=ccrs.PlateCarree(), cmap='RdBu')
    ax3.coastlines()

    # add_cyclic also works with 2-dimensional data
    # Cyclic points are added to data, longitudes, and latitudes to
    # ensure the dimensions of the returned arrays are all the same shape.
    lon2d, lat2d = np.meshgrid(lon, lat)
    cdata, clon2d, clat2d = cutil.add_cyclic(data, lon2d, lat2d)
    ax4 = fig.add_subplot(2, 2, 4,
                          projection=ccrs.Robinson(central_longitude=0))
    ax4.set_title("Cyclic 2d longitudes, central longitude=0",
                  fontsize='small')
    ax4.set_global()
    ax4.contourf(clon2d, clat2d, cdata,
                 transform=ccrs.PlateCarree(), cmap='RdBu')
    ax4.coastlines()

    plt.show()


if __name__ == '__main__':
    main()
Total running time of the script: (0分0.539秒)
Gallery generated by Sphinx-Gallery _