跳转至主要内容
Ctrl+K
cartopy 0.24.1 文档 - Home cartopy 0.24.1 文档 - Home
  • 入门
  • 画廊
  • 安装
  • API参考
  • 有什么新
  • GitHub
  • 入门
  • 画廊
  • 安装
  • API参考
  • 有什么新
  • GitHub

章节导航

  • 线和面
    • 自定义边界形状
    • 特征创建
    • 特征
    • 全球地图
    • 卡特里娜飓风
    • 龙葵特征
    • 海洋测深学
    • 旋转极箱
    • 错误引用椭圆的效果
    • 天梭指数
  • 标量数据
    • 添加循环点以帮助包装全球数据
    • Choropleth地图:将数据与几何关联
    • 等高线标签
    • 轮廓变换选项
    • 填充轮廓
    • 地图磁贴获取
    • 利用正极投影绘制NOAA的极光预报
    • 网格重新投影
    • 从地球同步投影重新投影图像
  • 向量数据
    • 箭头
    • 倒钩
    • 使用收件箱重新网格化载体
    • 流线图
  • Web服务
    • 在任意投影上复制WMSG拼贴地图数据
    • 交互式GMS(网络地图服务)
    • 交互式WMSG(Web地图磁贴服务)
    • Web地图磁贴服务时间维度演示
    • 网络磁贴图像
  • 网格线和标签
    • 对齐Cartopy和Matplotlib轴
    • 网格线和勾号标签
    • 勾选标签
  • 米西亚
    • 为网格表面制作动画
    • 卡托比·费维孔
    • Cartopy徽标
    • 初始化UTM投影的所有60个区域
    • 将数据复制到同心椭圆上
    • 在制图中修改地图的边界/整齐线
    • 地铁站
    • 联合国旗帜
    • 使用Cartopy和AxesGrid工具包
  • 画廊
  • 米西亚
  • Cartopy徽标

备注

Go to the end 下载完整的示例代码。
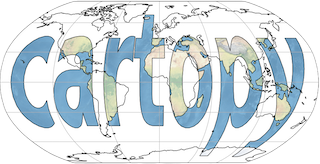
Cartopy徽标#

生成Cartopy徽标的实际代码。

logo
from matplotlib.font_manager import FontProperties
import matplotlib.patches
import matplotlib.pyplot as plt
import matplotlib.textpath
import matplotlib.transforms

import cartopy.crs as ccrs


def main():
    fig = plt.figure(figsize=[12, 6])
    ax = fig.add_subplot(1, 1, 1, projection=ccrs.Robinson())

    ax.coastlines()
    ax.gridlines()

    # generate a matplotlib path representing the word "cartopy"
    fp = FontProperties(family='DejaVu Sans', weight='bold')
    logo_path = matplotlib.textpath.TextPath((-171.01406, -39.33125), 'cartopy',
                                             size=80, prop=fp)

    # scale the letters up to sensible longitude and latitude sizes
    transform = matplotlib.transforms.Affine2D().scale(1, 2).translate(0, 35)

    # add a background image
    im = ax.stock_img()
    # Apply the scale transform and then the map coordinate transform
    plate_carree_transform = (transform +
                              ccrs.PlateCarree()._as_mpl_transform(ax))

    # add the path as a patch, drawing black outlines around the text
    patch = matplotlib.patches.PathPatch(logo_path,
                                         facecolor='none', edgecolor='black',
                                         transform=plate_carree_transform)
    im.set_clip_path(patch)
    ax.add_patch(patch)

    plt.show()


if __name__ == '__main__':
    main()

Total running time of the script: (0分1.669秒)

Download Jupyter notebook: logo.ipynb

Download Python source code: logo.py

Download zipped: logo.zip

Gallery generated by Sphinx-Gallery _

上一页

卡托比·费维孔

下一页

初始化UTM投影的所有60个区域

© © Copyright 2011 - 2018 British Crown Copyright, 2018 - 2025 Cartopy contributors..

由 Sphinx 8.3.0创建。

使用 PyData Sphinx Theme 0.16.1构建.