
备注
Go to the end 下载完整的示例代码。
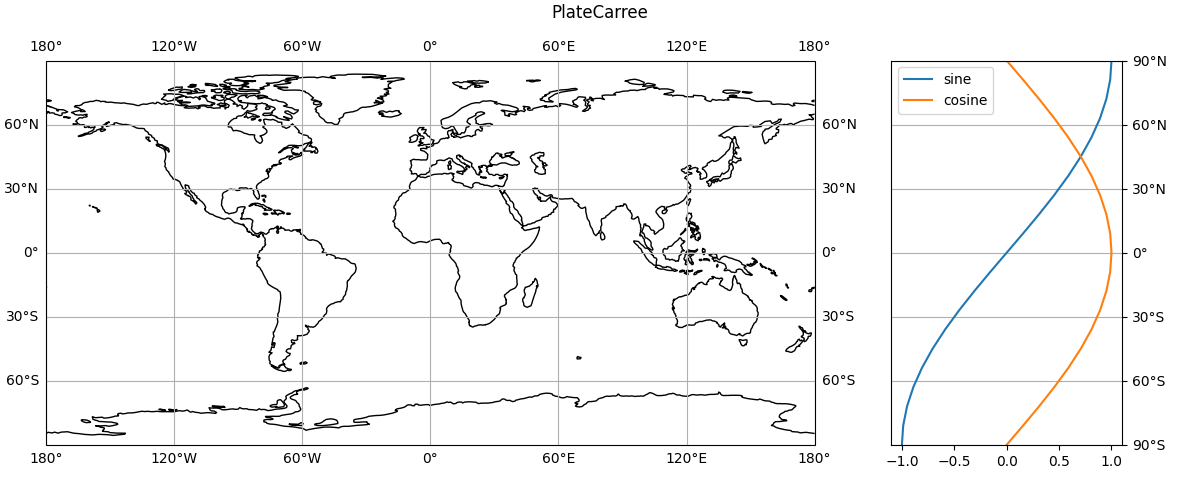
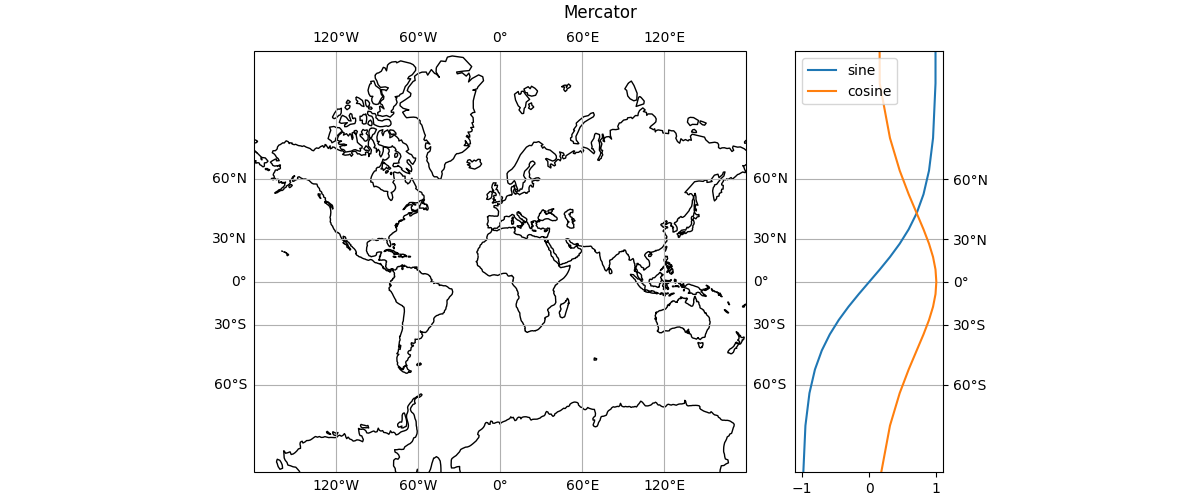
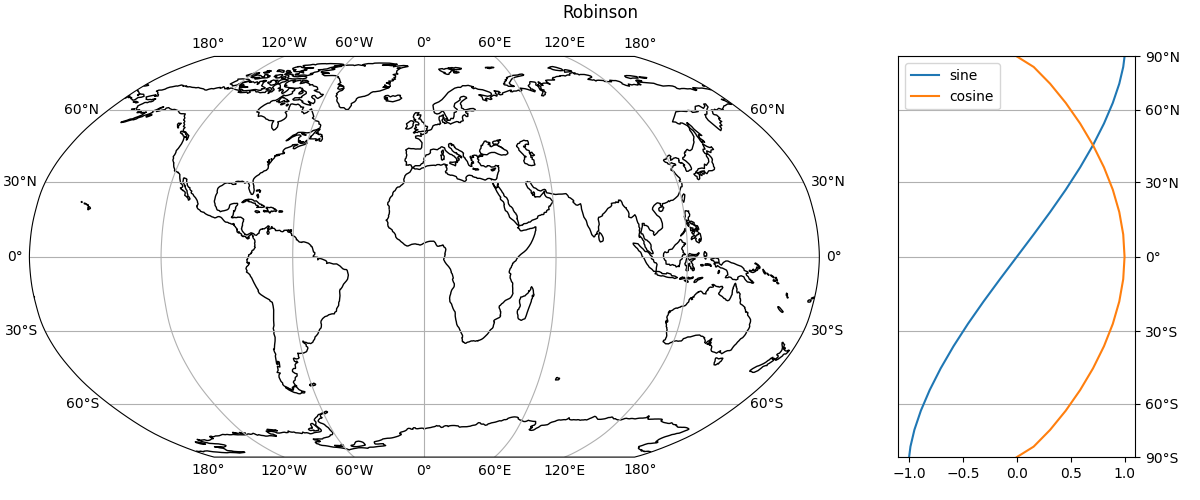
对齐Cartopy和Matplotlib轴#
有时,将标准Matplotlib轴与Cartopy地图对齐很有用,例如在全球等值线图旁边绘制纬向平均数据时。 此示例演示了一种用于纬度线水平投影的方法。
# sphinx_gallery_multi_image = "single"

import matplotlib.pyplot as plt
import numpy as np

import cartopy.crs as ccrs


PC_PROJ = ccrs.PlateCarree()

def map_and_latitudes(map_proj):
    """
    Create a map with the given projection, together with a rectangular axes
    whose y-axis matches the map.
    """

    fig = plt.figure(figsize=(12, 5), layout='compressed')

    # Create the map.
    map_ax = fig.add_subplot(projection=map_proj)
    map_ax.set_global()
    gl = map_ax.gridlines(draw_labels=True)
    map_ax.coastlines()

    # Add the rectangular axes to the right of the map.
    rect_ax = map_ax.inset_axes([1.1, 0, 0.3, 1])

    # Set up scaling for the rectangular axes latitudes.  This part is
    # necessary for projections with uneven latitude spacing, such as Mercator,
    # but can be skipped for PlateCarree for example.
    # Create functions to map between latitude and the projection's y values.
    # Assume these are not x-dependent so we can just set x/longitude to zero.

    def to_map(lat):
        """Transform latitudes to projection's y-values."""
        dummy_lon = np.zeros_like(lat)
        projected = map_proj.transform_points(PC_PROJ, dummy_lon, lat)
        return np.take(projected, 1, axis=-1)

    def from_map(y):
        """Transform projection's y-values to latitude."""
        dummy_x = np.zeros_like(y)
        projected = PC_PROJ.transform_points(map_proj, dummy_x, y)
        return np.take(projected, 1, axis=-1)

    # Use these function to define the y-scale on the rectangular axes.
    rect_ax.set_yscale('function', functions=(to_map, from_map))
    # Convert the map's y-limits to latitudes and set the y-limits.
    rect_ax.set_ylim(from_map(np.array(map_ax.get_ylim())))

    # y-axis visual choices.
    rect_ax.grid(axis='y')
    rect_ax.yaxis.tick_right()
    rect_ax.yaxis.set_major_locator(gl.ylocator)
    rect_ax.yaxis.set_major_formatter(gl.yformatter)

    # Plot some dummy data.
    y = np.linspace(-90, 90, 21)
    y_rad = np.deg2rad(y)
    rect_ax.plot(np.sin(y_rad), y, label='sine')
    rect_ax.plot(np.cos(y_rad), y, label='cosine')
    rect_ax.legend()

    # Add the projection name as the title.
    fig.suptitle(type(map_proj).__name__)


if __name__ == '__main__':
    for map_proj in [ccrs.PlateCarree(), ccrs.Mercator(), ccrs.Robinson()]:
        map_and_latitudes(map_proj)

    plt.show()
Total running time of the script: (0分2.732秒)
Gallery generated by Sphinx-Gallery _